
Maps
Spatial map types and their uses
Spatial maps visualise geographic data and spatial relationships.
If you have a spatial relationship you would like to represent, there is a map for that.
Choropleth Maps: best for displaying regional data like density or distribution
Heat Maps: best for identifying clusters and concentration patterns
Topographic Maps: Best for: elevation (contour lines) terrain and navigation
Dot Density Maps: Best for showing distribution patterns
Isopleth/Isoline Maps: Best for connecting points of equal value (temperature, noise etc.)
Flow Maps: Best for show movement patterns between locations( migration, trade)
3D Maps: Best for adding height dimension to geographic data( terrain and complex spatial relationships
Example uses: Urban planning, geological studies, gaming environments
Digital Interactive Maps: Bets for complex data exploration and analysis (GIS, navigation apps)
SACE 2024
Refer to the topographic map and Source 1.
State the direction the photograph in S1 is taken from. (1)
What is the approximate longitude of the Wollongong Head lighthouse? (GR 079891) (1)
151 00 E
34 00 S
151 00 N
34 00 E
Points A, B, C and D are shown on the cross section in source 2. Referring to the line X-Y on the topographic map, identify the location of each of the following features. (3)
Kembla Lookout
Youngs Gully
Unanderra Highway
Kembla West
Refer to topographic map to answer Q 4.
A tourist train runs from Berkley road railway station (GR 022 854) to Dombarton level crossing (GR 944857). Following the rout of the train, describe one significant change for any two of the following characteristics: Direction, elevation and land cover. (2 and 2)
Characteristic 1 & 2 and significant change 1 & 2.
Refer to Source 3 and the topographic map when answering Q 5 .
A major industrial manufacturer in Australia has a steel production facility at Port Kembla in Wollongong (AR 0585)
Evaluate the suitability of this location for steel production facilities. (4)
Refer to Source 4 and the topographic map when answering Q 6.
Much of the Wollongong / Port Kembla area has undergone significant change over time. describe how the area has changed since 1927 . (3)
Refer to source 4 when answering question 7, 8 and 9.
Describe the distribution of vegetation for category >90% native vegetation in the source. (1)
Evaluate the effectiveness of this method of presenting the data (3)
Suggest and justify an alternative method for presenting the vegetation data in the source (2)
Method
Justification
Refer to source 4, 5 and 6 to answer question 10 - 15.
Provide the relevant fieldwork technique to replace A in the table. (1)
Provide the correct hypothesis to replace B and F in the table (1)
Provide the relevant justification to replace C in the table. (1)
Provide the relevant fieldwork technique to replace D in the table. (1)
Provide the correct method to ensure validity to replace E in the table. (1)
Provide the relevant fieldwork technique to replace G in the table. (1)
Refer to the topographic map to answer question 16.
Using Box B on the topographic map, identify two ecosystem services within the Illawarra escarpment state conservation area and explain how these services contribute to human wellbeing. (4)


S1. Wollongong lighthouse
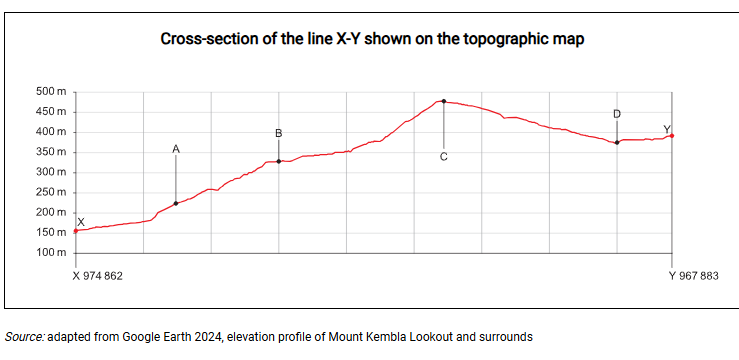
S2. Dune cross section
S3. Pt Kembla 1928
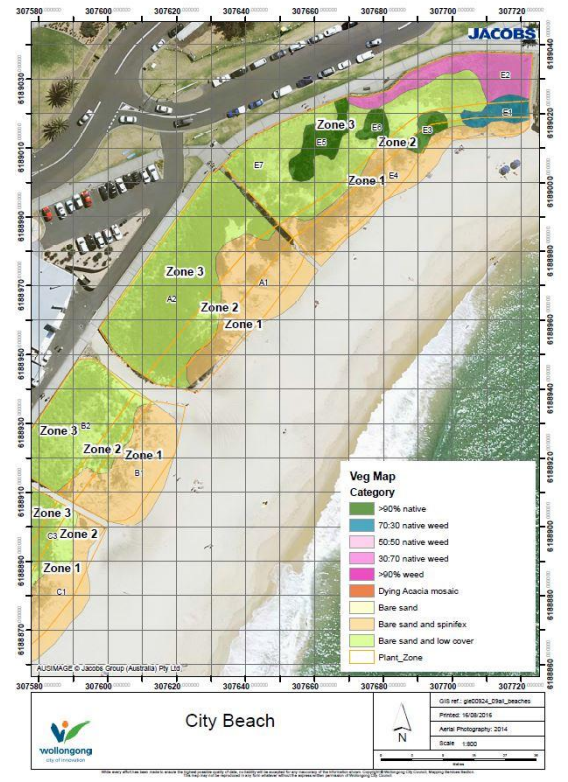
S 4. Vegetation survey

S 5. Hypothesis
SACE 2023
Identify two sources of water pollution that could be found upstream of GR 739945. (2)
Explain how the physical landscape has influenced the distribution of human settlement in the area shown on the topographic map. Provide specific map evidence using area references and/or compass directions. (3)
Identify the scale closest to that used in the satellite image.
Select your answer from the list below. (1)
1:13 00
1:25 000
1:50 000
1:100 000
For a council considering land use in the area, suggest two advantages of using the satellite image compared to using the topographic map. (2)
Identify the feature marked T on the satellite image. (1)
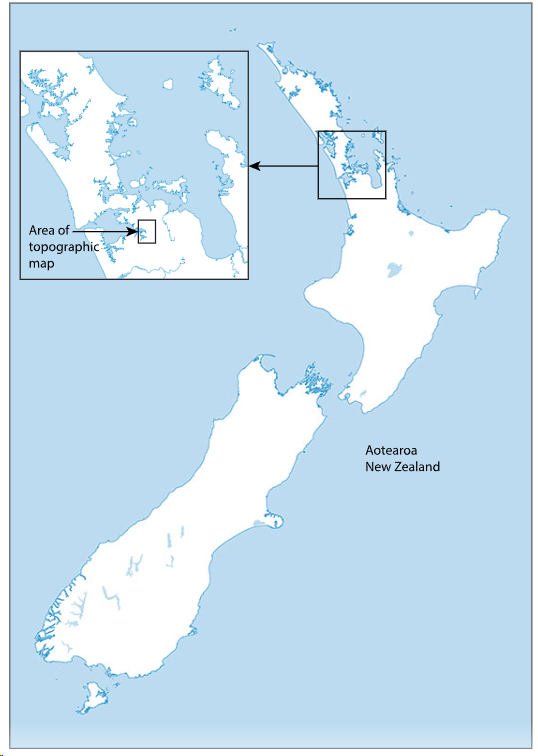
Southern Auckland is experiencing increasing levels of housing development.
Using only evidence from the topographic map, analyse similarities and differences in the suitability for this type of development of the locations chosen in: (5)
Box A (area references 7397, 7398, 7497, 7498, and 7598)
Box B (area references 7192 and 7292).
SACE 2022
Refer to the Topographic map Isle of Anglesey, scale 1:50000, when answering questions 1-4.
Refer to the points W1 (GR 377947) and W2 (GR 463935)
The total distance covered by the National Trail between W1 and W2 is closest to which of the following distances?
10 40 80 120
Which two features would you encounter while walking along the National Trail between W1 and W2? (2)
Picnic site / windmill / National Trust site / Garden / Mixed wood
Refer to the photograph and the topographic map when answering question 3 -5
The photo was taken from a point off the north-east coast of the Isle of Anglesey at a bearing of 205 degrees.
At which of the following points was the photographer located (1)
GR 447947
GR 482940
GR 507908
GR 496891
Refer to the following locations P (GR 395930) , Q (GR447898) and R (GR367877) on the topographic map when answering Questions 4 and 5.
The letters P, Q and R are located near some of the wind farms on the Isle of Anglesey
Suggest one physical factor that would make these locations suitable for wind farms. (1)
Refer to the topographic map
The T junction near the centre of the town of Llangefni (GR462757) is closest to which of the following latitudes? (1)
53 13' N
53 15' N
53 17' N
53 19' N
A local railway activist group is campaigning to reopen the disused railway route through the town of Llangefni.
Identify a suitable location for a railway for the town.
Justify your choice of location, providing advantages, disadvantages and at least one limitation (4)
The scale of the part of the Isle of Anglesey map is 1:50 000
Which of the following would be a more appropriate for assessing the suitability of a site for a railway station? (1)
Explain your choice (1)
Evaluate the connectivity of the Isle of Anglesey as a location for an industry or a business (4)
SACE 2021
State two ways that relief is shown on the map of Gladstone. (2)
If 2cm on a satellite image represents 500 m on the ground, what is the scale of the satellite image? (1)
1:1000
1:5000
1:25000
1:50000
You have been asked to prepare a report on the potential environmental risks of the aluminium smelter at GR 310530.
Locate and describe four risks you have identified at the site. (4)
Use the answer model to structure your response.
The grid reference
Name of the feature (Not always possible)
Vegetation type (Use the key!)
Distance (Use the scale!)
Orientation (Use the compass)
Area C on the topographic map includes a coal fired power station and associated infrastructure bordering a range of ecosystems. To monitor air quality a particulate matter testing system is located at GR 207624.
High levels of particulate matter have been detected at the testing site that can also be seen in Source 2.
Using source 1 and 2, suggest which zone 1,2,3 or 4 is the most likely source of particulate matter at the testing site. (2)
Additional data from Area C is required in order to monitor the overall health of ecosystems. Sites X, Y and Z have been chosen for collecting water samples.
Suggest why these site have been chosen. (2)
Identify two different fieldwork techniques for collecting data to monitor ecosystem health within Area C and outline why they are relevant. (2)
Describe two ways of representing ecosystem health data
Source 1. Particulate matter
Particulate matter is coal ash and dust.
Coal dust can be released as ships are loaded and unloaded with coal.
Coal ash contains many toxic elements including, but not limited to, arsenic, cadmium, lead, mercury, and selenium.
Contaminants from coal ash can and do leach through the bottom of ash dumps and into groundwater, run off into surface water such as rivers and lakes, and dry out and blow over communities.

