Geography skills help us interpret data, read maps, and understand spatial patterns. These skills allow us to gain a broader understanding of people, places, and environments.
We are going to start with maps.
Why make a map?
Maps help Geographers understand the world by showing locations, patterns, and spatial relationships. They help us visualise data and enhance navigation skills. Geography skills help us interpret data, read maps, and understand spatial patterns. These skills allow us to gain a broader understanding of people, places, and environments. Using maps we can build our geographical knowledge and analyse environments, human activity, and changes over time.
To do: Map basics
Part 1. Latitude and Longitude
Latitude and longitude are imaginary lines used to locate places on Earth. They form a grid system that helps identify exact global positions and coordinates.
Draw and label the four hemispheres using the equator and the prime meridian
Draw and label latitude on the globe
Draw and label longitude on the globe
Part 2. The Compass
A compass shows us direction using the cardinal points. North, south, east, and west. The compass helps us accurately navigate and understand the orientation of the map.
Draw another circle in your book.
Fill in the points of the compass, include the intermediate points

Part 3. The Map Scale
Scale shows the relationship between distances on a map and real-world distances. It helps users measure and understand the size and distance between locations accurately.
Using a ruler draw a scale 1:25 000. (where one cm equals 250 m)

Part 4. The Map Legend
A map legend explains the symbols and colours used on a map. It helps us understand features like buildings roads, rivers, boundaries, and land use clearly.
To do: Create a St Johns map legend.
Draw a map of St Johns
Create a legend of all of the important locations in the school.

Using your G skills to read a map
Part 4. Using the map
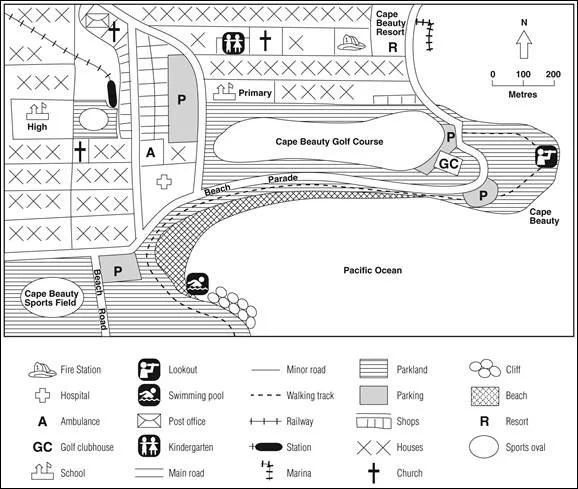
Answer the following compass and map legend questions using the map of Cape Beauty
How many churches are shown on the map?
Only one type of shop is specified – which one is it?
Which school is the railway line closest to?
What do the letters N, S, E and W on the compass stand for?
In which direction is the sports field from the high school?
In which direction is the lookout from the resort?
In which directions does the train line run when it leaves Cape Beauty Station?
Which direction is the Fire Station from the high school?
Imagine you are outside the Ambulance and walk due west. What are the features that you would pass?
Now make up your own direction questions. Try them out on your classmates.
2. Geographic coordinates
Geographic Coordinates
The geographic coordinates are a grid system that was created to locate any place on earth.
Grid lines are used to identify locations on a map.
Introducing the gridlines. Eastings and Northings
Each grid line has a number that can be found on the edge of the map.
The eastings are labelled at the bottom of the map.
The northings are labelled on the side of the map.
An area reference uses the easting first and the northing second.
Example: Using area references to find a location.
When you record the location you use the eastings first and the northings second.
A = AR 85 53
B = AR 84 52
C = AR 84 52

Using area references to find a location on a map.
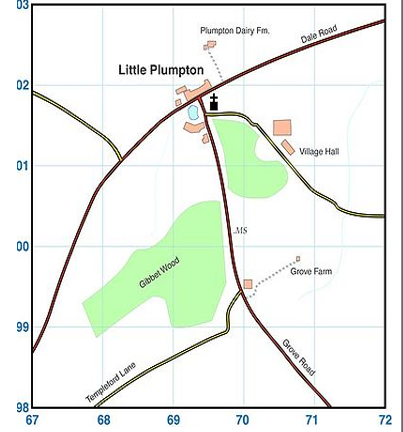
What are the area references for the 7 sites on the Little Plympton Map?
Part 5. Area referencing questions
Write down the area reference (AR) for the following locations.
Plumpton Dairy Farm
Village Hall
Grove Farm
Gibbet Wood
Little Plumpton
The Church
The AR’s of Templeford Lane
Calculating the Grid Reference of a location.
If you want a more specific location you can calculate the six figure Grid Reference (GR).
For the grid reference (GR) you just have to imagine each AR square divided by ten.
B = AR 8452
B = GR 842528
C = AR 8452
C = GR 848524

Part 5. Grid referencing questions
What is the name of the town at GR 197 836?
What is the land form at GR 194 814?
What is the function in AR 21 83?
What are the two spot heights on the Shatton Edge (AR 19 80 and 20 81)?
Describe the land use at Grid Reference (GR) 208 828
Extra: Compass bearings
Which direction is Shatton AR 197 824 from Thornhill AR 198 835?
What is the direction of Bamford 207 837from Shatton 198 835?

3. Contour lines
A Topographic map has contour lines that show the shape and elevation of the land.
A contour line represents an imaginary line on the ground, above or below sea level. All points on the contour line are at the same elevation or height.
To do: Contour line questions
At what elevation would the ground be between the 400 and 500 lines?
What is the contour interval on this map?
If you walked from point A straight to point B, by how much would the elevation increase?
If you walked from point B to point C, would this be a steeper or flatter walk than from point A to B? How do you know?

DIY - contour line drawing
On the top of this drawing is the contour map representing the hills in the drawing below it.
The vertical distance between the contours is ten meters.
To do: questions
Which hill is higher A or B?
Which is steeper A or B?
How many meters of elevation are there between contour lines?
How high is Hill A…………………Hill B……………………………….
Are the contour lines closer together on Hill A or Hill B?
What does this indicate about the shape of each hill?
Extra: Using the graph paper make your own topographical representation.
Note: Try starting with the hills and then create your contour representation.
