Fieldwork Resources
GIS with MyMaps: How to start
1. Sign in to: Google My Maps
2. Click on the Create a new map button (the red one in the left hand corner)
3. Click on Untitled Map to give your map a title and description EG BNP fieldwork
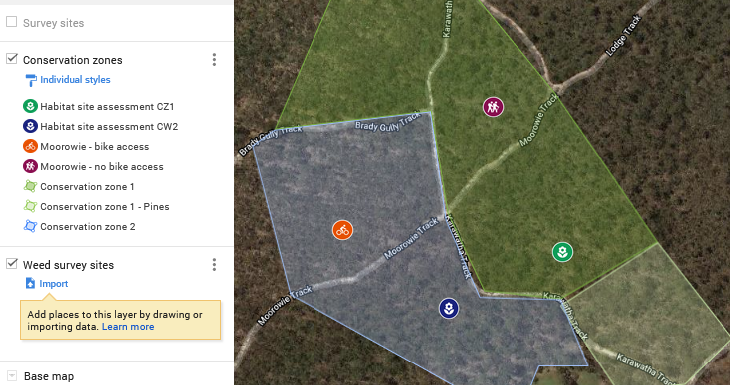
Change your base map to satellite for a more detailed view.
4. Select Add layer and Import data
5. Select your excel file and import the data.
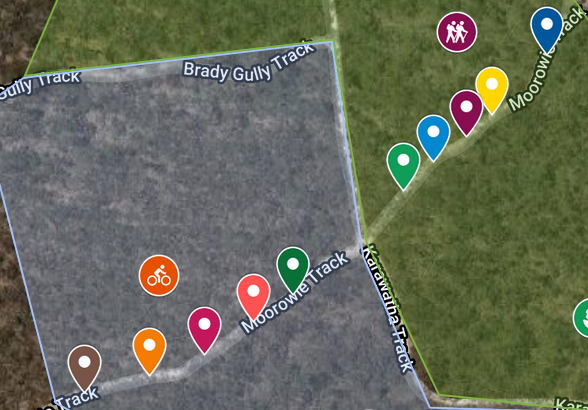
6. Google will ask you to tick the place marks. Tick Latitude and Longitude
7. Next choose a column to title your markers: Total
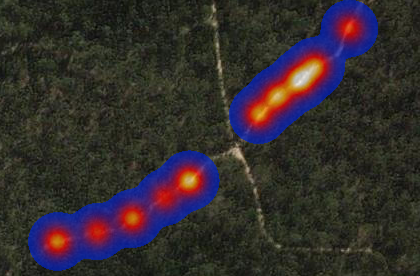
8. Click on the styled by total and choose a colour that represents a sliding scale
(eg dark to light) or just colours.
Ensure that you use screen shots of the GIS maps to illustrate your discussion.
Sharing a MyMap
If you have gone to the trouble of creating a GIS map to support your report or project.
It would be good if other people are allowed to look at it.
Use the following steps to ensure everybody can view your GIS map.
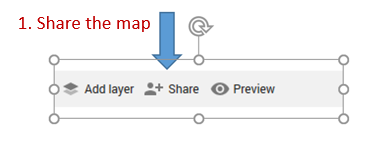
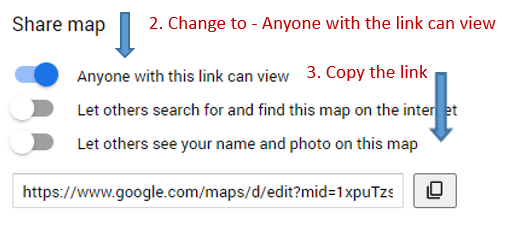
1. On the My Maps page select: Share
2. The map will be private by default. But you can change access.
Select: Anyone with the link
3. You can then copy the sharing link and insert into your report.
Satellite image sources
For crystal clear satellite images
Go to the ARCGIS Map Page
The google My Maps platform is excellent for distance and routes
Open Google MyMaps here.
Google Earth provides excellent satellite imagery clarity.
Go to Google Earth
Transects
What is the purpose of a transect?
Measuring everything (A census) would take to long.
A transect ((a line along which data is collected) takes a representative sample of the population in the survey area. The transect is divided into Quadrats.
Quadrats.
The usual sampling unit is a quadrat. The purpose of using a quadrat is to enable comparable samples to be obtained from areas of consistent size and shape. It does not really matter what shape of quadrat is used.
Along each of the transects use a systematic sampling strategy to select locations to record your data. The size of the sample will usually be dictated by the time availability. The larger the sample, the more likely it is to give a true picture of the population you are sampling.
The minimum number of samples which should be taken to be truly representative of a particular area, can be calculated by graphing the number of features recorded, as a function of the number of samples examined.
For example:
recording land use every 10m
recording species at random intervals
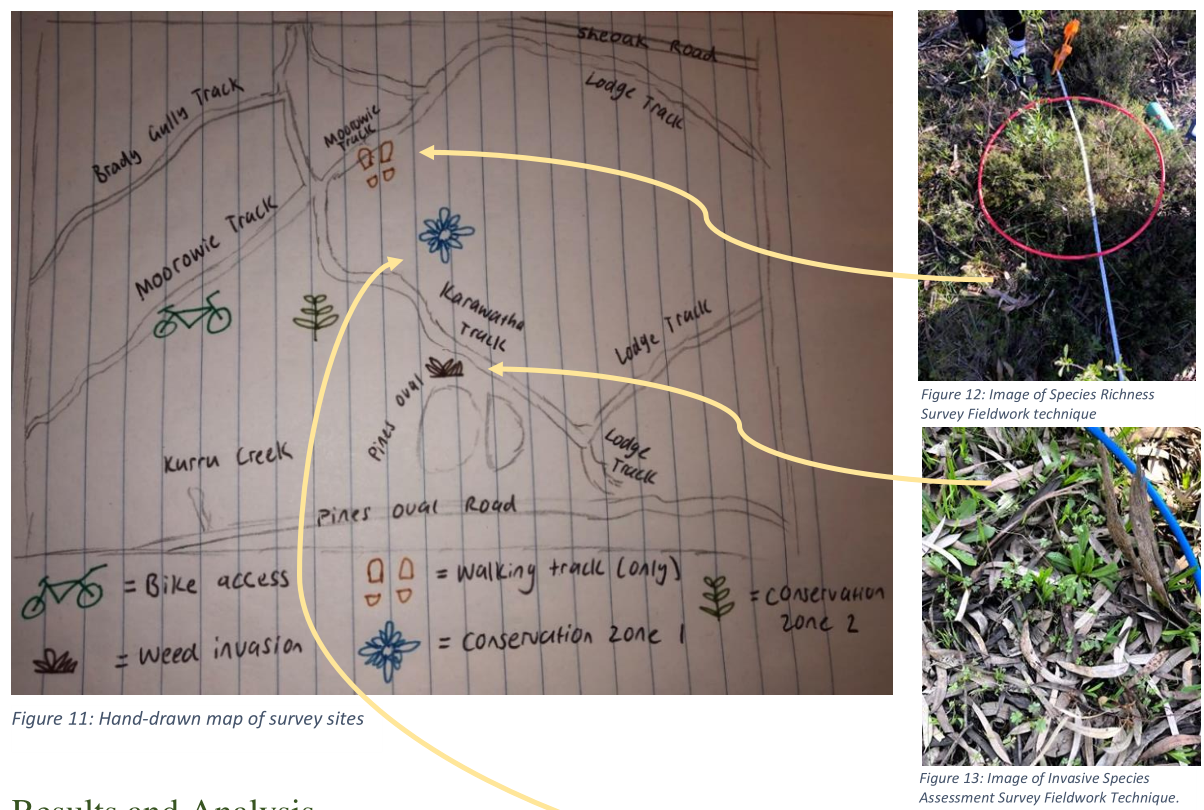
Sketches and Mud Maps
Sketches
Always use pencil
No colour - just shading
Divide the page into grids to make it easier
Use a viewing frame
Sketch the horizon first
Main lines only (detail is good for important features)
Give your sketch a full and detailed title
Draw the landform first. Add trees and other details last
Label the key geographical features
Statistics - The T Test
The t test is a way to tell if the difference between before and after results is significant or if those results could have happened by chance.
For example, you could test water quality upstream and downstream from a new development and compare the results to see if the development has led to a decline in water quality.
It’s mostly used to test if means are different. The larger the t-value, the larger the difference in the two samples.
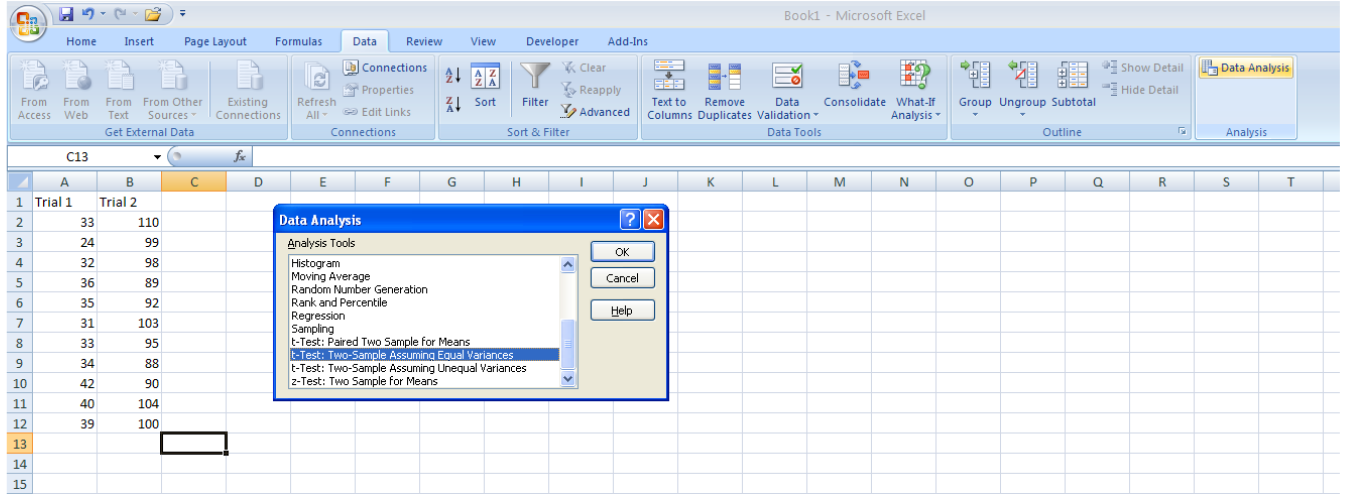
Using Excel to do a T test
Arrange your data in columns:
Click on the Data menu and select the data analysis tab.
Select the Analysis Toolpak and click GO
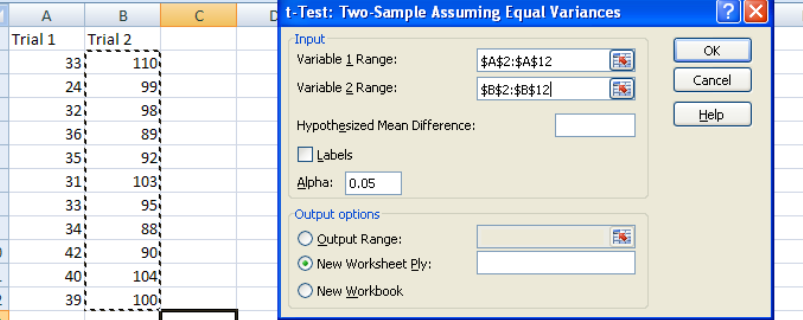
You will now see a window listing statistical tests, scroll down to T Test - Two sample assuming equal variances and click OK
Now input the cells containing your data in Variable 1 and Variable 2.
The default Alpha of 0.05 will be sufficient for our needs
The results will appear in new sheet.
The most important result is the P - value.
We set our Alpha at 0.05 so a result less than 0.05 suggests a statistically significant difference between the two sites.
If it isnt installed you need to install it
If it is not in the right corner you can download it by going to the file menu and selecting Options / Add ins.
Annotations
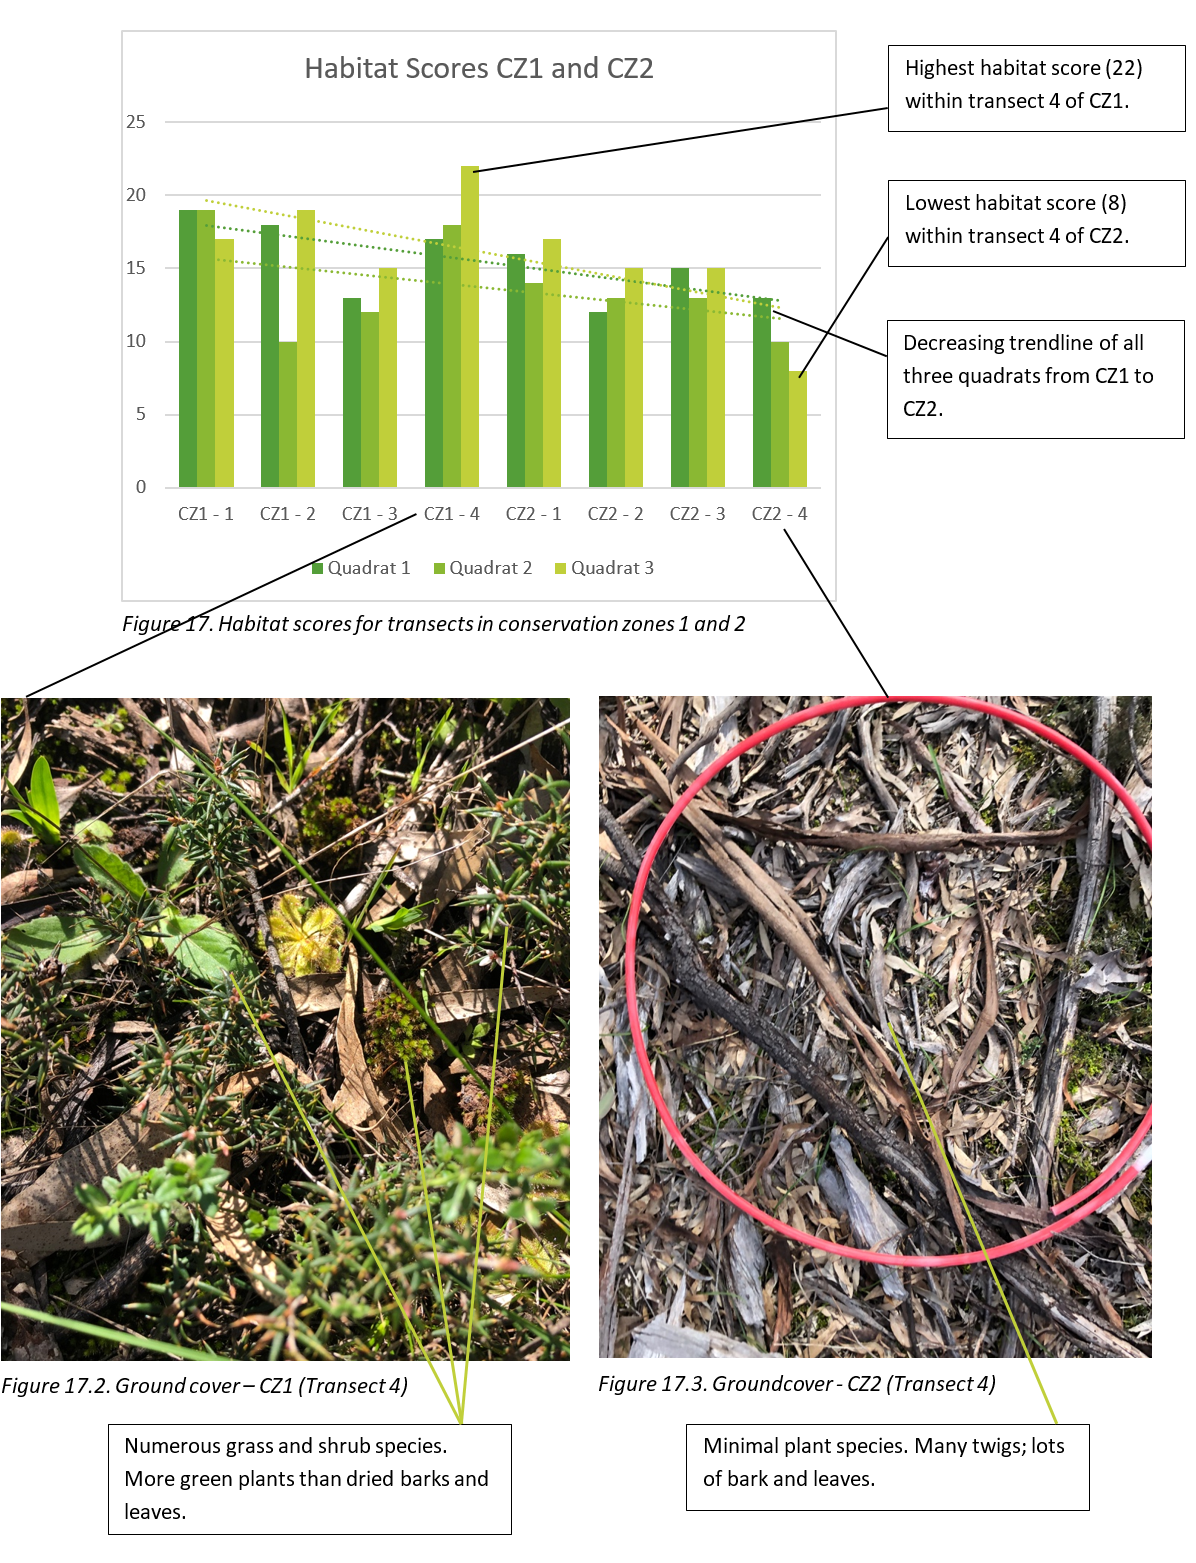
Use annotations and labels to highlight relevant information and examples.
All of your diagrams, photos, graphs and maps need to be annotated.
Photographs (as annotations) can be arranged around a map extract, field sketch or diagram as a visual presentation of certain features, areas or processes.
Care should be taken to ensure that the field sketches and photographs are clearly incorporated into the investigation and that their purpose is explicit; otherwise their worth is questionable and may even devalue the report.
A label = anything less than 10 words long, NOT INCLUDED in the word count
Annotation = any label exceeding 10 words long, INCLUDED in the word count