Fieldwork Revision
Fieldwork basics
Start with a clear hypothesis / aim (Question)
Select a representative survey area/ group to minimise bias
Include a control group for a benchmark comparison
Use a fieldwork method/technique that captures the relevant data
A note on sampling valid data:
Random sampling - selecting a person to interview or site to measure, at random. Random sampling is unbiased as particular people or places are not specifically selected.
Systematic sampling - collecting data in an ordered or regular way, eg every 5 metres on a transect, or every fifth person.
Stratified sampling - dividing sampling into groups, eg three sites from each section of coastline, or five people from each age range. It is possible to combine stratified sampling with random or systematic sampling:
Stratified random sampling - random samples are taken from within certain categories
Stratified systematic sampling - regular samples are taken from within certain categories
Possible questions
Explain the benefits of satellite images / topographical maps in fieldwork
What is the advantage of collecting fieldwork data at the same time / different times?
State two additional types of data to collect.
Explain the value of a representative sample.
Identify two data collection techniques that could be used to carry out a fieldwork investigation at the following sites.
SACE 2023
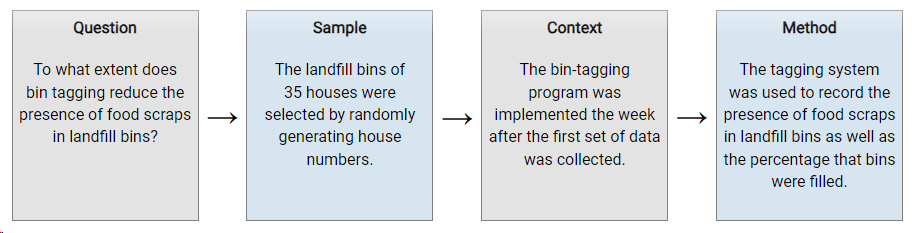
Student researchers set up a field study to investigate whether a new housing development within Box B on the topographic map was meeting Auckland Council's target of zero waste to landfill by 2040.
The following fieldwork process for evaluating bin tagging was adopted
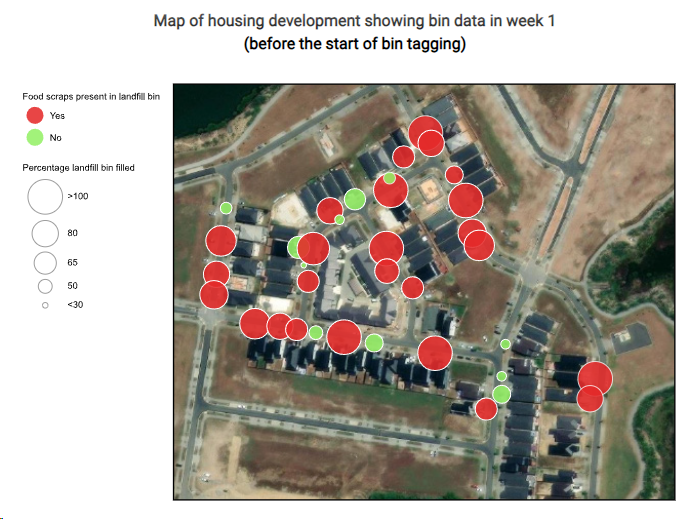
Source 2. Before bin tagging
Source 4. Auckland sustainability targets.
The council for Auckland, the largest city in Aotearoa New Zealand, has set several sustainability targets, with the aim of creating a liveable, resilient, and low-carbon city.
The list includes an aim to send zero waste to landfill by 2040, by reducing waste at the source, and increasing recycling and composting.
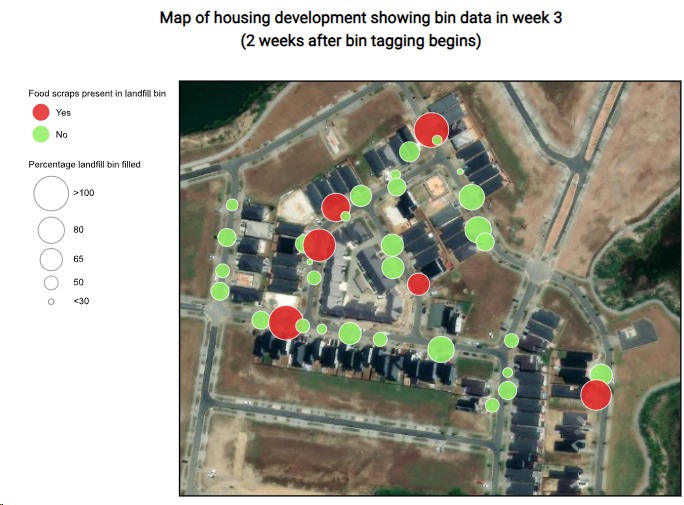
Source 3. After bin tagging
Source 5. Further sustainability targets
Auckland Council's plan for sustainable development includes numerous other targets, two of which are summarised below.
Biodiversity: Auckland aims to protect and enhance the city's biodiversity, by restoring native habitats, protecting natural areas, and promoting sustainable land practices.
Active transport: Auckland aims to promote the use of 'active' transport such as walking and cycling — to reduce greenhouse gas emissions and improve public health.
Source 6. How does bin tagging work?
Bin-tagging programs are designed to educate households in the correct use of general waste bins, whose contents go to landfill (commonly known as landfill bins). Councils place notices on bins after inspecting them during collection. The tags provide feedback on the use of the bin for
food waste, as shown below.
To do: questions
Explain how the process outlined above is an effective way to collect fieldwork data. (4)
Examine Sources 2 and 3, which show the results of the field study, and then answer parts (b) and (c).
Evaluate the effectiveness of Sources 2 and 3 as a way of displaying bin data. (3)
Based on the data shown in Sources 2 and 3, justify why bin tagging in the new housing development in Box B has been
successful in working towards Auckland Council's target of zero waste to landfill by 2040 (Source 4). (2)
For each of the two targets outlined in Source 5, identify and justify a distinctly different fieldwork technique.
Fieldwork technique for biodiversity (2)
Fieldwork technique for traffic (2)
SACE 2020
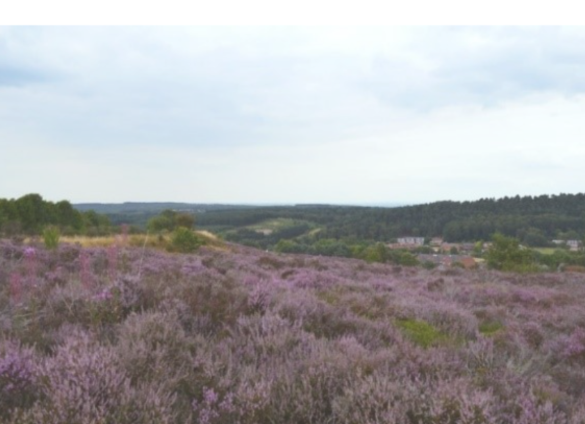
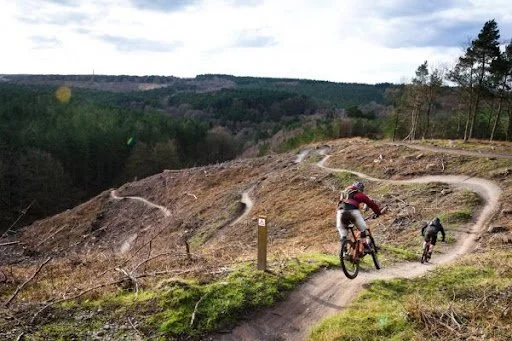
Cannock Chase Urban Park
Cannock Chase Urban Park is an area of 68 square kilometres to the north of Birmingham. The park is an area of outstanding natural beauty that has been designated for conservation due to its significant landscape value. It is also home to a range of outdoor activities. The area consists of a mixture of natural deciduous woodland and heathland (scrubby grassland with low shrubs), along with introduced plantations of coniferous trees. There have been efforts in recent years to regenerate the heathland through a replanting program.
The area attracts in excess of 300 000 visitors per year. There are extensive walking trails through Cannock Chase Urban Park, including sealed trails for easy access for wheelchairs and strollers, and unmarked trails through vegetated areas. The site is also home to a number of purpose-built mountain-bike trails. Further tourism features include the 'Go Ape' adventure rope course and numerous cafes, pubs, and visitor centres. Refer to the information provided about Cannock Chase Urban Park when answering Question 6 a and b.
Questions:
a. State a fieldwork hypothesis or inquiry question that could be applied to Cannock Chase Urban Park. (1)
b. Identify three appropriate fieldwork techniques for investigating your hypothesis or inquiry question. (3)
SACE 2019
Liveability fieldwork
A group of students investigated building height and liveability within the central business district of a city in order to test the two hypotheses below.
Hypothesis 1: Liveability increases with distance from the centre of the city.
Hypothesis 2: Building height decreases with distance from the centre of the city.
To test Hypothesis 1, the students carried out a bipolar analysis to determine the liveability score for each of nine locations along a transect of the city (Source 1).
The bipolar analysis was conducted at 9 am, 2 pm, and 7 pm on the same day, every 200 m along the transect.
An example of the data collected at one location at one time is shown in Source 2.
Questions
Explain why this is an effective way to collect fieldwork data. (3 marks)
Suggest one additional factor that could be included in the bipolar analysis (Source 2) that would allow further analysis of liveability. Justify your answer. (2 marks)
Evaluate the effectiveness of the method of displaying liveability data as shown in Source 1. (3 marks)
Use Source 1 to explain the liveability scores at each end of the transect. (2 marks)
To test Hypothesis 2, the heights of major buildings along the transect were measured in storeys, and their distance from the centre of the city was measured in metres (m)
State the relationship between the two variables shown on the graph in Source 3. (1 mark)
Should Hypothesis 2 be accepted or rejected? (1 mark)
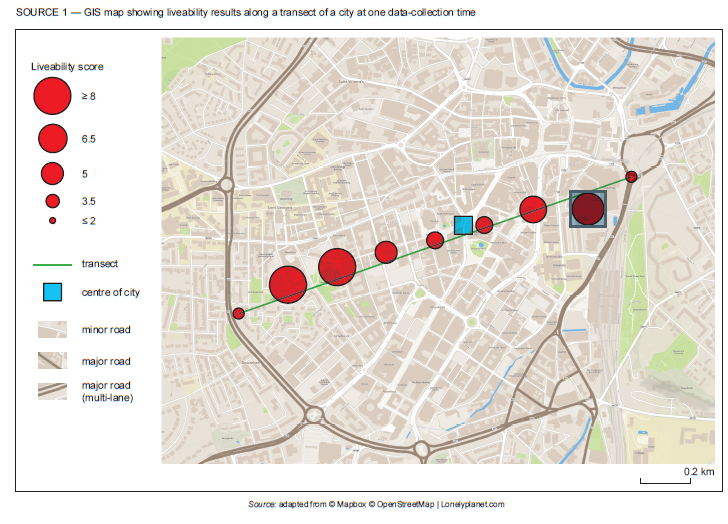
Source 1. GIS map showing transect of city at one time
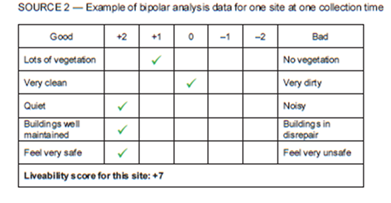
Source 2. Bipolar analysis at one time
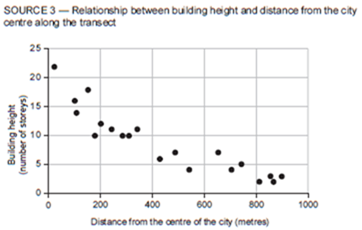
Source 3. Building height and distance from city