G Revision
Exam question checklist
Plan each answer/ response before you start.
State your topic/example clearly, do not overdo it.
One example / evidence with supporting facts for each point.
Use the following model for each point.
Name - Purpose - Example
Name - Description - Example
Omit needless words!
Cheat list
Read the question - what are the key words, what do they want me to do?
Have a plan, so you don’t forget stuff
Use evidence for every question!!
Be specific, stop rambling, you don’t have time
Do not, under any circumstances, rewrite the question.

1. How to answer exam questions like a boss
Do as many practice questions as possible.
The most effective way to answer exam questions correctly is through practice.
For Geography skills, just reading through notes doesn’t work. Use the revision questions to practice your understanding and answer structure
Read the question
This seems obvious. And yet.
First, pick out the key words and terminology. These words specify what you need to write about. Ensure that when start your answer you are doing exactly what is asked of you by the key words.
Terminology
Exams are not a place to write a blog or social media post. Use the correct Geography terminology and processes in your answers.
Key words
The following is a summary of how extended responses (or essays) are to be answered (under exam conditions):
Describe: Give a detailed account, emphasising main points. No interpretation of the facts is necessary.
Explain/analyse: You must interpret the issues raised by the question/statement. Try to explain ‘why’ and ‘how so’. You must offer reasons. Ensure that all descriptions are very brief.
Outline/summarise: Give the main points, leave out the details.
Compare/contrast: Look for similarities and differences between the items. Ensure that a real comparison is made, by comparing contrasting issues.
Discuss: Explain what you understand the topic or issue to be. Present your point of view. Use your knowledge of the topic to provide strong evidence and reasoned arguments to support your viewpoint. Avoid unnecessary description, but give essential background details which are necessary to support your argument. Assume the reader is informed on the topic. Facts are vital.
Evaluate: Be objective and examine each issue. Present a balanced view, with supporting evidence. Give reasons for and against.
‘Comment on’, ‘Do you agree’ and ‘To what extent’ are essentially the same as discuss.
The marks should guide your answer
The marks rewarded determines how much and what, should be in your response.
For example, 4 mark questions require two pieces of evidence, there is no time for waffle., use the Pee structure if you are confused.
PEE
P – start with a simple POINT or statement and definition if appropriate
E – Provide an EXAMPLE or some evidence
E – EXPLAIN why or how that point links to the question
Example question:
Account for the variation in total fertility rates between high income and low income countries.
Refer to social and economic factors in your response. (4)
Describe the variation in TFR between high and low income countries with specific country examples from LIC’s and HIC’s. (2)
Describe social factors that cause variation in TFR (1)
Describe economic factors that causes variation in TFR (1)
Planning your answer
Which aspects of the question are you best at explaining? There is no expectation that you will cover everything. So concentrate on the points you know well.
For example, if the question asks you about the reasons for forced migration and you know a lot about a country with a civil war.
Talk about that.
The number of points you should discuss is either determined by the question or by the marks and line allocation.
Omit needless words.
All of your points should be concise, directly addressing the question, with evidence to support your answer.
Simple sentences are good sentences.
You do not have time to waffle!
Evidence!
The importance of examples cannot be stressed enough when you answer questions. Every ecosystems case study, every population dynamic topic and all migration trends, NEED EXAMPLES.
Use statistics, news articles, events, etc, they are essential to get the top marks.
However: Make sure your evidence and examples are relevant and answer the question. (See read the question above) As good as evidence is, there’s no point using it if it doesn’t enhance your response.
Another tip, is to be constantly gathering up to date statistics and illustrative examples that link to the content
2. Population
Population key ideas
Fertility / birth rates are still high in some LEDC's
Fertility / birth rates are declining rapidly in the rest of the world as a result of increasing development
Life expectancy is increasing with increased development
Youthful populations are a potential economic benefit and challenge
Ageing populations face economic / social challenges
Governments use natal policies to shape country demographics.
Population exam questions
There are four types of questions in the population topic.
Economic, political and social causes of changing fertility trends
Economic, political and social impacts changing fertility trends
Challenges of youthful populations and ageing populations
Political (government) policies to influence fertility (anti natal and pro natal)
Example question:
Refer to the graphs to describe and account for the change in child mortality (Under 5) rates and fertility rates between 1986 and 2016
Example response: Between 1986 and 2016, the child mortality and fertility rates have decreased significantly. In 1986 the child mortality rate was approximately 10%. By 2016 the child mortality rate had decreased to 4%. During this period the same pattern occurred in fertility rates, in 1986 the highest fertility rate was 7.8 in the Central African Republic and the world average was 3.5. By 2016 , the world average had declined to 2.5 children per woman. The correlation between these two data sets may be explained by increased nutrition, health care and family planning leading to a decline in IMR and CMR resulting in reduced fertility rates as populations adapt to increased child survival.
Notes
The question does not require you to explain or evaluate, you are being asked to describe and account for the changes in child mortality.
Population revision in 5 points
Causes of high / low life expectancy
Causes of high / low birth rates (Reasons for a young/ageing population)
Advantages /Disadvantages of high birth rates
Advantages / Disadvantages of low birth rates
Describe a pro natal / ant natal strategy
SACE 2021
With reference to a specific example, evaluate one way in which a government has attempted to change birth rates. (4)
SACE 2023.
State the relationship between life expectancy and GDP per capita shown in the source. (1)
With reference to the source and/or examples from your studies, explain the reason for the relationship between life expectancy and GDP per capita. (5)
SACE 2020
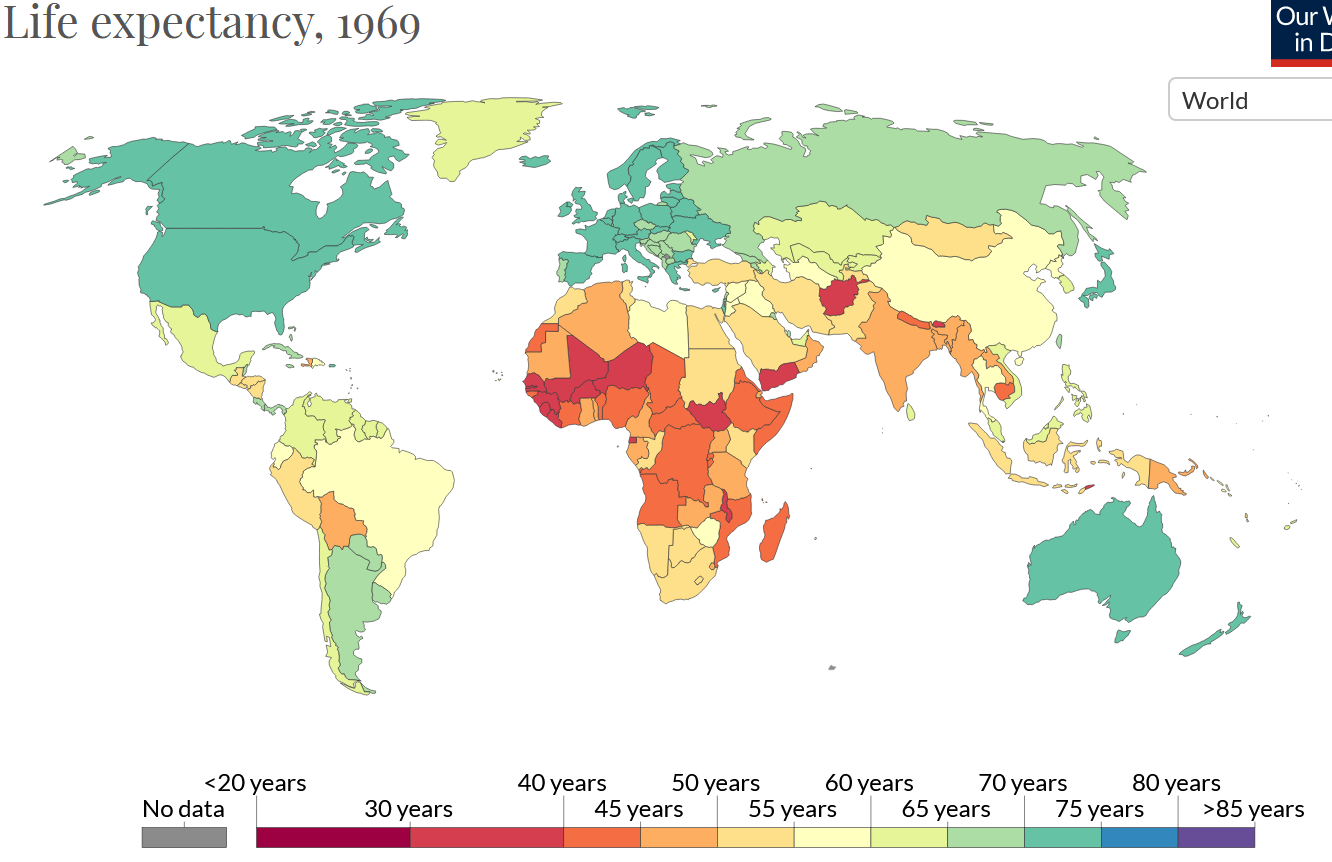
Refer to the following global life expectancy maps for 1969 and 2019 when answering question 1-3.
Describe and explain changes in life expectancy between 1979 and 2019 in LEDC and MEDC countries (4)
Apart from increasing life expectancy identify the other factor that is leading to a growing proportion of elderly people in the world's population (1)
Explain how an increase in a country's % of older people might affect government policy. (3)

SACE 2024
What is meant by the term ‘total fertility rate? (1)
Explain, with reference to different factors in each response, why total fertility rates are declining in both LEDC’s and MEDC’s.
Reasons for decline in MEDC’s (2)
Reasons for decline in LEDC’s (2)
SACE 2022
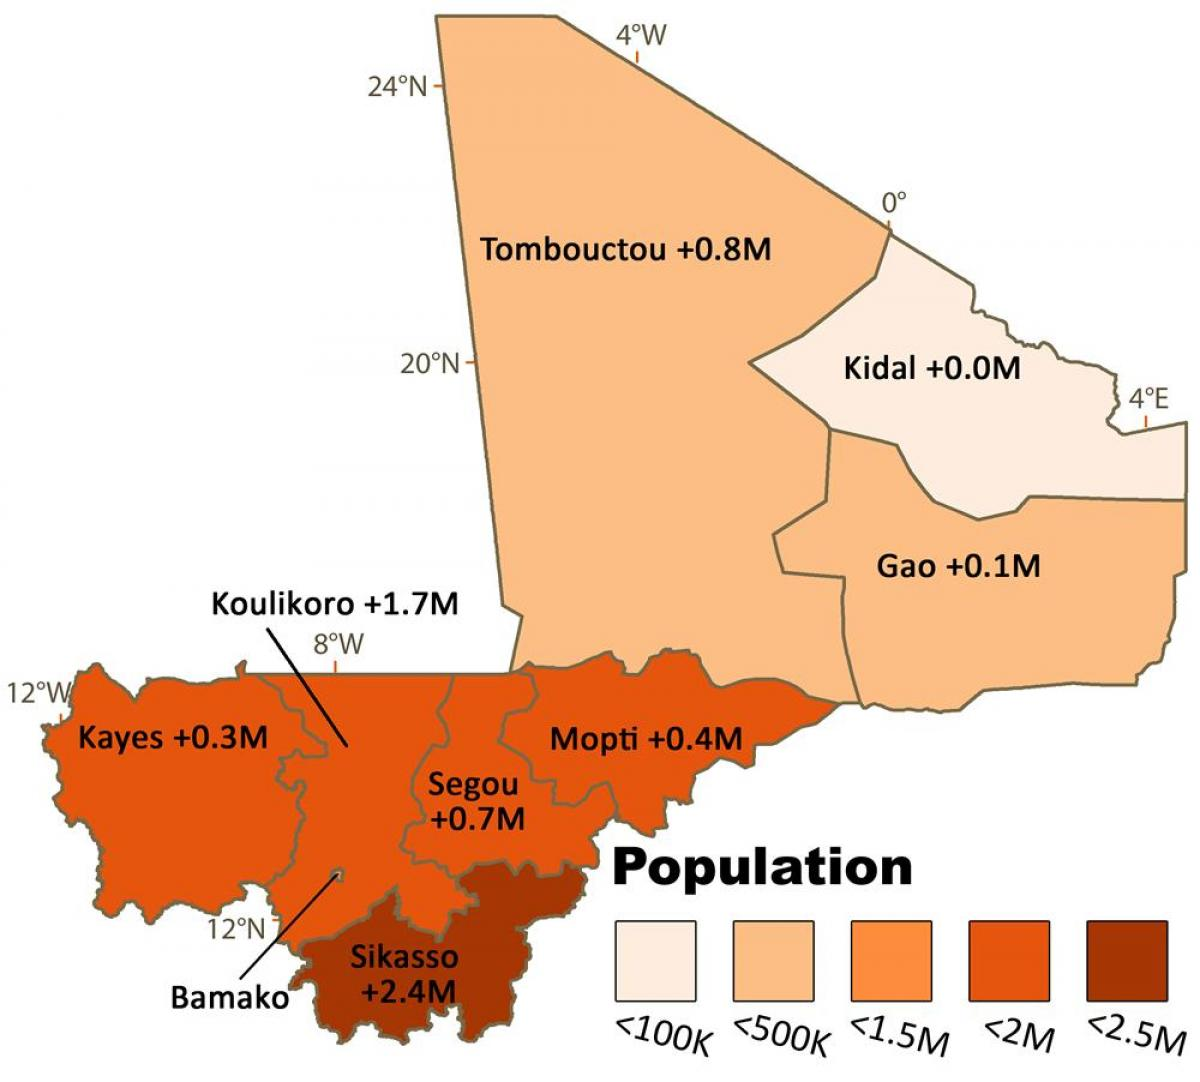
Death rates have been steadily declining on a global scale. However in some countries, such as Mali, the birth rate remains high. With reference to information provided in the source, explain why the birth rate remains high in Mali.
Reason 1. (2)
Reason 2. (2)
Reason 3 (2)
Countries such as Japan now have fertility rates that are at or below their population replacement rate
Using an example from your studies, explain one strategy that a government has used to increase birth rates.(3)


SACE 2019
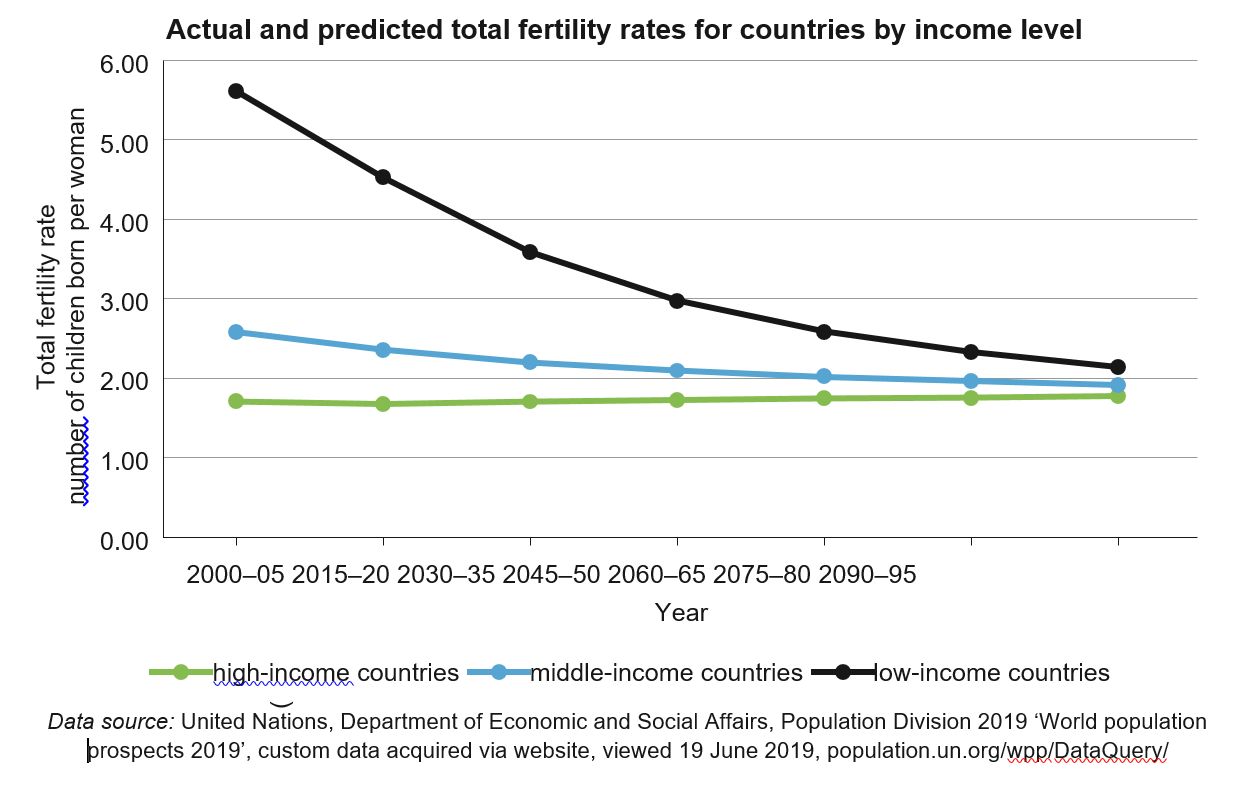
Describe (Give a detailed account) the trends in the total fertility rate for high-income, middle-income, and low-income countries.(2)
Consider the total fertility rates for 2015–20.
Explain (Give a detailed account social/economic causes) the variation in total fertility rates between high-income and low-income countries. Refer to social and economic factors in your response.(4)

3. Population Pyramids
Population pyramids - Key ideas
The age and sex structure of a population refers to the number or proportion of males and females who are in each age category.
Age-sex structure tells us about a population's past trends in fertility, mortality, and migration. It also provides information about the population's potential for future growth.
The greater the proportion of people in the younger-adult age groups, the greater the potential for more births and population growth.
Pyramid revision in 6 points
Identify the characteristics of a ageing population (Old age dependency ratio)
Identify the characteristics of a youthful population (Youth dependency ratio)
Social and economic impacts of a youthful / ageing population structure.
Social and economic consequences of the pyramid structure in 50 years.
A government policy to address the issues raised by the population structure. (Natal, Anti natal)
SACE 2018
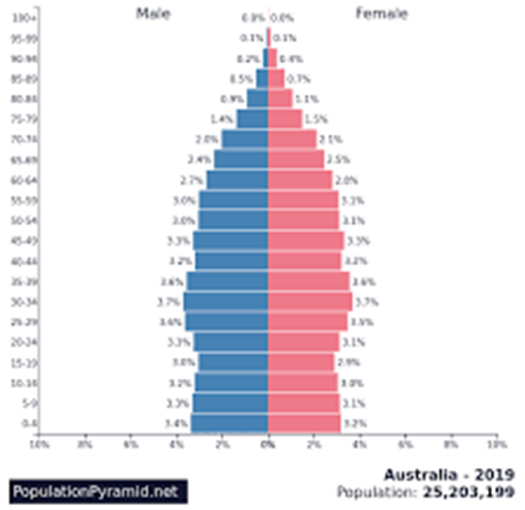
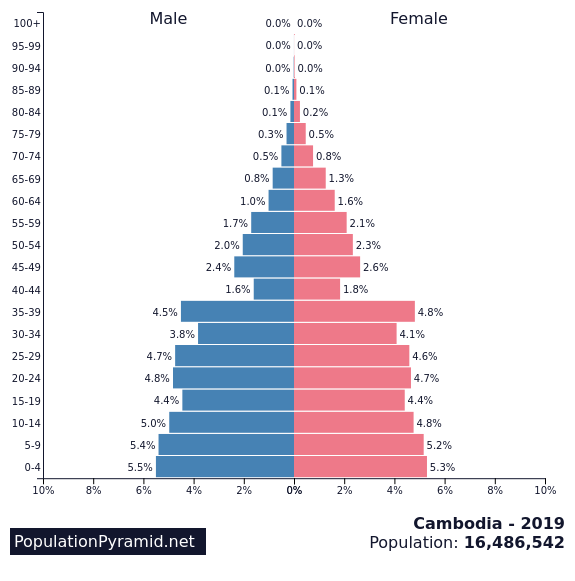
Refer to the Australian and Cambodian pyramids
Identify and explain the key demographic characteristics of the Cambodia pyramid. (2)
With reference to the pyramids identify two key differences between the population structure of Australia and Cambodia (2)
Explain the likely economic and social consequences of the two changing population structures over the next 50 years. (4)
Outline a government strategy to address the population issues for each pyramid. (4)
SACE 2021
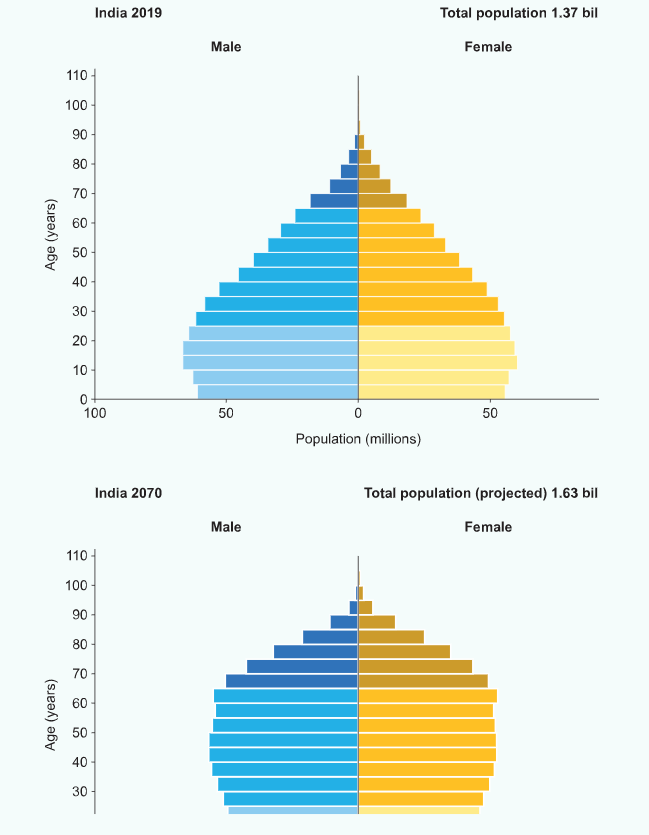
Refer to the pyramids: India 2019 and 2070 for questions 1-4
Describe how India's population structure is projected to change between 2019 and 2070. (3)
Refer to the population structure projected for India in 2070.
Explain one opportunity for the Indian government given the projected population structure. (2)
Explain one concern facing the Indian government given this projected population structure. (2)
With reference to a specific example, evaluate one way in which a government has attempted to change birth rates. (3)
4. Population distribution
Population distribution - Key Ideas
Population density - the number of people who live in an area per square kilometre.
Places which are densely populated contain many people.
Places which are sparsely populated contain few people.
Global population is not evenly distributed
Global population is concentrated in areas with favorable climate, soil and coastal access.
Population distribution exam questions: There are three types of questions in the pop distribution topic..
Identify three characteristics of global population density shown on the map.
Outline the physical and human factors that influence population density
State two reasons why most of the world’s population in the year 2020 was distributed between 20º and 40º north of the equator.
A note on population distribution and map questions. You are being asked to describe the distribution.
Do not explain when the command word asks you to describe! You should always try to make full use of the map details to add sophistication to your response. State the main pattern – is it linear (in a visible line), nucleated (all in one area) or scattered (everywhere – there is no pattern).
Look at the map to see if there are any features on the map that also allows you to describe it – equator and the tropics labelled? If so, write about them too.
Give examples – names of countries, or if you are struggling with that then you can use continent names. Be careful though – if for example you can see on the map that rainforests are found in Africa you need to be clearer than just stating "Africa". "Central Africa" would get you the mark, not just "Africa" as rainforest is only in a small central region.
SACE 2024
Explain one physical factor that has affected patterns of global population distribution. (3)
SACE 2022
Referring to the sources, describe and explain the pattern of settlement in Mali. (3)

SACE 2021
1. With reference to Map A, outline three factors that are likely to have influenced the population density pattern shown in Map B.
Outline: Give a brief account or summary

SACE 2020
Explain how the changes in land cleared for urban development and land cleared for agriculture are interrelated. (2)
Describe the changes in the distribution of urban development in Area A between 2000 and 2020 (2)


SACE 2019
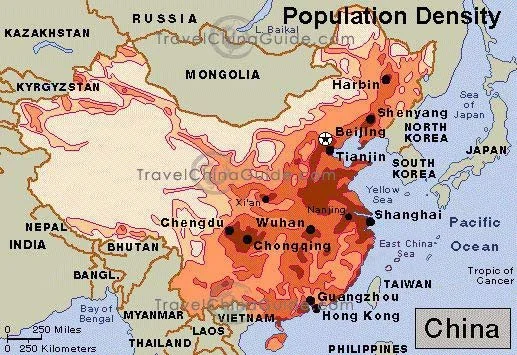
Refer to the following population density map and the relief map for China.
Outline the environmental and economic factors that influence the population distribution in China. (3)
Describe the population distribution of China with reference to the relief map of China (1)
Identify two reasons for the low population density in western China. (1)
5. Migration
Migration - Key ideas
Global population is not evenly distributed - why?
People migrate as a result of a combination of push and pull factors
Voluntary migration - people looking for a better life
Forced migration - no choice but to migrate
Migrants have positive and negative impacts on the source/host/destination
Destination communities have political responses to migrants
Use contemporary case studies to illustrate the causes and consequences of movements of people in specific locations.
Migration revision in 6 points
Define voluntary and forced migration
What are the causes of voluntary /forced migration?
Define internally displaced persons (IDP's)
List Push factors & Pull factors
The advantages / disadvantages of remittances
Advantages / disadvantages of migration for source / destination country

SACE 2020
When people migrate, there are a range of impacts on the country or region they leave.
Using examples from your case studies , discuss the social and economic impacts on the source country. (4) (2+2)
SACE 2021
Using at least one case study, explain how migration of people can lead to both positive and negative impacts for the destination country or region (6)
SACE 2022
Countries such as Japan now have fertility rates that are at or below their population replacement rate.
Explain two ways that a country with a declining population, such as Japan, could benefit from increasing the inward flow of voluntary migration. (4)
SACE 2023
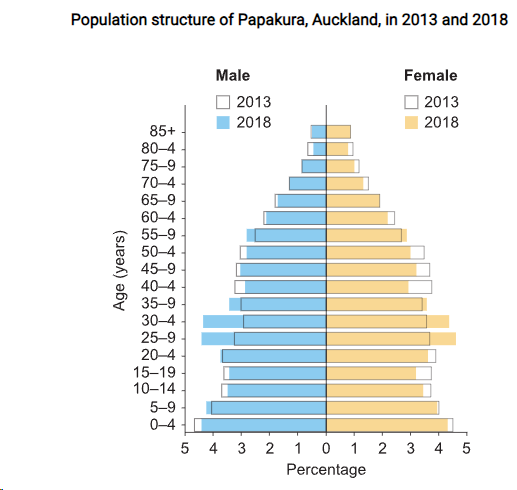
With reference to Source 1. Describe how the population structure of Papakura, in southern Auckland, changed from 2013 to 2018. (2)
With reference to Sources 2 and 3, suggest pull factors that might attract people to relocate to Papakura from other parts of Auckland. (4)
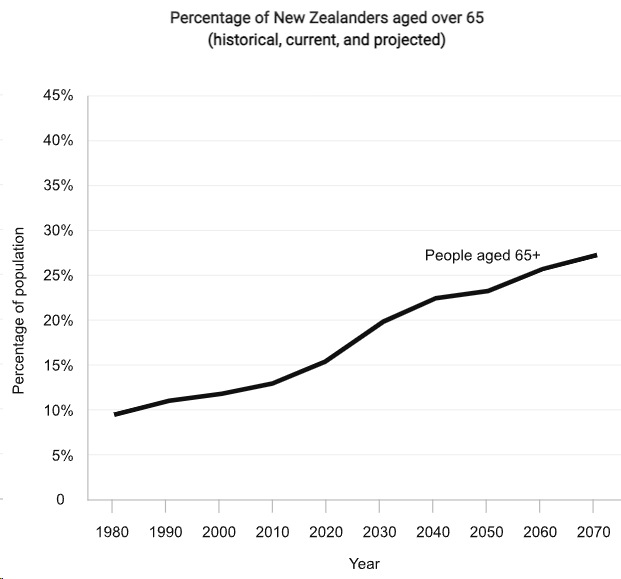
New Zealand has an ageing population, as shown in Source 3.
With reference to New Zealand, or any example from your studies, discuss the implications of an ageing population. (5)
Source 1.
Source 2. Population growth in Papakura
At the 2018 Census there were 57,636 usual residents in Papakura, an increase of 12,000 people since the 2013 Census. This represents a 26.3% increase between 2013 and 2018. Papakura has grown much more quickly than wider Auckland (11.0% increase).
Papakura age structure
At the 2018 Census 23.6% of Papakura Local Board’s population was under 15, compared to 20.0% of Auckland. 10.5% were 65 or older, compared to 12.0% of Auckland.
Source 3.
SACE 2024
Identify one push factor that relates to volutary migration, and one push factor that relates to forced migration.
Push factor that relates to voluntary. (1)
Push factor that relates to forced. (1)
There has been a significant increase globally in movements of highly educated migrants.
Explain how an increase in highly educated immigrants may affect a destination county or region. (2)
With reference to specific examples from your studies, evaluate the effects of outward migration on origin countries/ regions. (6)
6. Ecosystems
Ecosystems: Key Ideas
Healthy ecosystems provide a range of services - Regulating, supporting, cultural and provisioning
Human impacts / habitat degradation causes a decline biodiversity / habitat / ecosystems
This reduces availability provision of ecosystem services
This negatively impacts ecosystem characteristics
Conservation strategies can protect and enhance ecosystems
Ecosystem exam questions
There are three types of questions in the Ecosystems topic.
1. The impact of decline in habitat / biodiversity on availability of ecosystem services
2. The impact of decline in habitat / biodiversity on ecosystem characteristics.
3. Conservation strategies to conserve or restore habitat / biodiversity / ecosystems
Don't forget the recipe!
Definition
Examples
4 ecosystem services with examples
ecosystem characteristics with examples
Explanation. IE impact of habitat degradation on ecosystem characteristics or services
Evidence from the source (if applicable)
Ecosystems revision in 10 points
Definitions
Ecosystem
Ecosystem services
Ecosystem characteristics
Ecosystem components
Biodiversity
Habitat
List the ecosystem services with examples - regulating / provisioning / cultural / supporting
Human activities that impact ecosystem services - examples
List the Ecosystem characteristics with examples
Human activities that impact ecosystem characteristics - examples
List the Ecosystem components with examples
Human activities that impact ecosystem components with examples
Conservation strategies for ecosystems - minimum of 4
SACE 2023
Refer to Sources 1 and 2 when answering question 2.
The section of Drury Quarry currently being worked is nearing the end of its lifespan. A proposal has been put forward for local consultation to expand the quarry into areas north-east of the current site.
1. Outline how the land-cover change in the proposed expansion could affect the following components of the ecosystem. (4)
a. Water
b. Soil
c. Flora
d. Fauna
To offset the quarry's environmental impact, the mine has introduced strategies to protect and restore local habitats. One such strategy is a conservation plan for copper skinks (a type of lizard) in the area. This conservation plan includes maintaining a fenced, 2500 m2 release site for skinks. Any skinks found in areas where quarry work is taking place will be transferred to this release site.
2. Suggest one positive and one negative effect of the skink conservation plan on the ecosystem shown in Source 3. (2)
Population growth leads to land-cover change in a variety of ways.
3. Excluding mining activity, use examples from your studies to explain two ways that population growth can cause land cover change. (4)
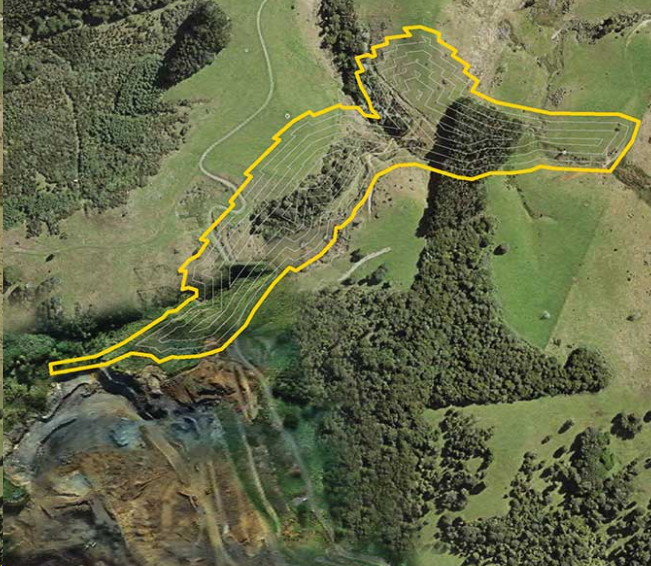
Source 1. Proposed extension
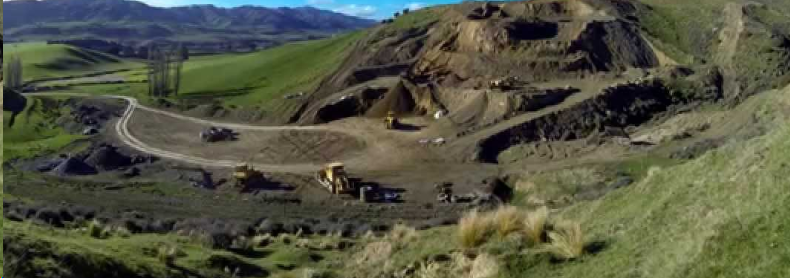
Source 2. Drury Quarry
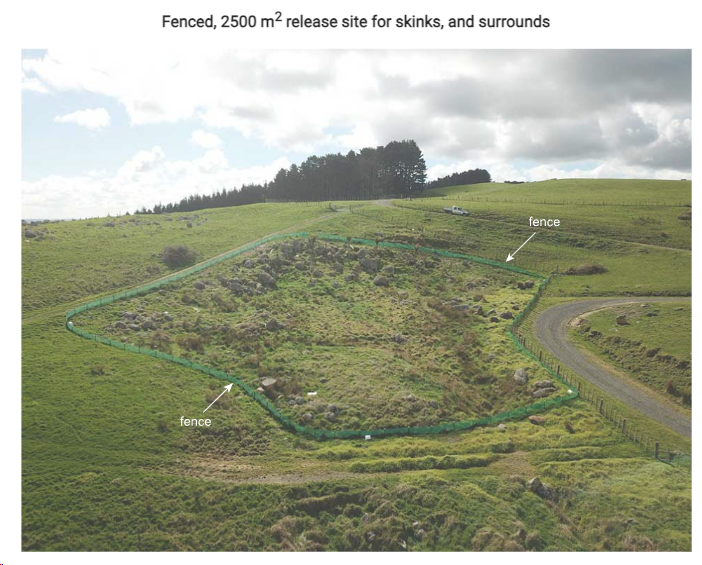
Source 3. Skink protected area
SACE 2022
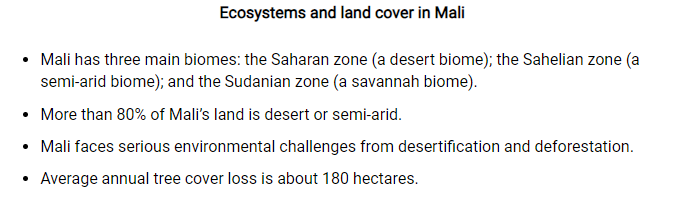
Suggest two reasons why low-income countries such as Mali experience deforestation. (2)
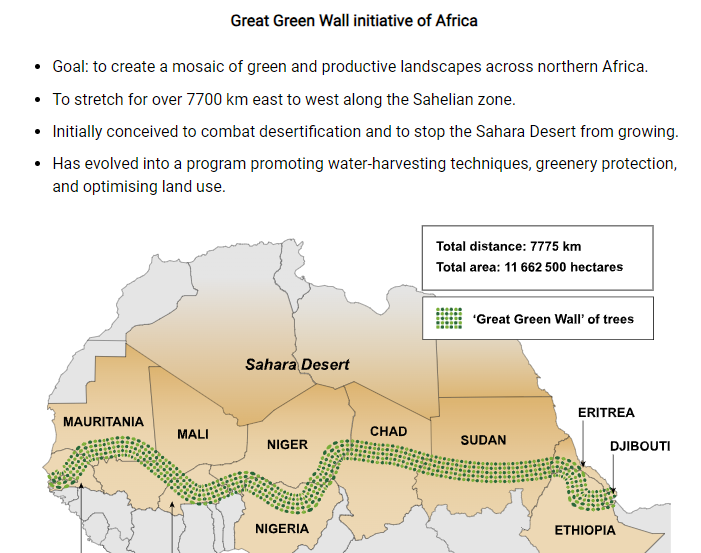
Mali is a participant in the Great Green Wall initiative.
Explain how increasing biodiversity through reforestation would impact ecosystem characteristics.
In your answer, refer to the following ecosystem characteristics: water, soil, atmosphere, vegetation, and other living things. (4)
These changes to ecosystem characteristics would improve ecosystem services.
Explain what an ecosystem service is and identify one service that would be improved by the Great Green Wall. (4)
The Great Green Wall initiative would be one way of improving the sustainability of ecosystems.
Outline two other strategies to improve ecosystem sustainability. (2 and 2)
SACE 2021
Components of an ecosystem
Explain how changes in land cover can damage different components of an ecosystem.
Identify and explain strategies for improving the sustainability of ecosystems.
SACE 2020
Using examples from your studies, explain how changes in land cover can cause damage to different components of an ecosystem. (5)
SACE 2019
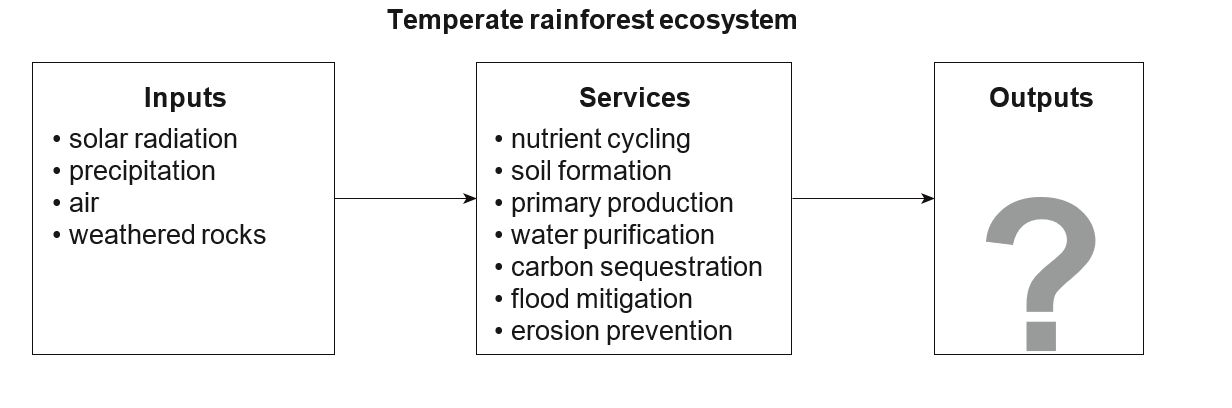
Refer to the diagram.
Around 10% of Tasmania’s land surface is covered in temperate rainforest.
State three possible outputs of a forest ecosystem. (3)
Explain the impact of decreased biodiversity on ecosystem services. Refer to some of the services listed in the diagram. (5)
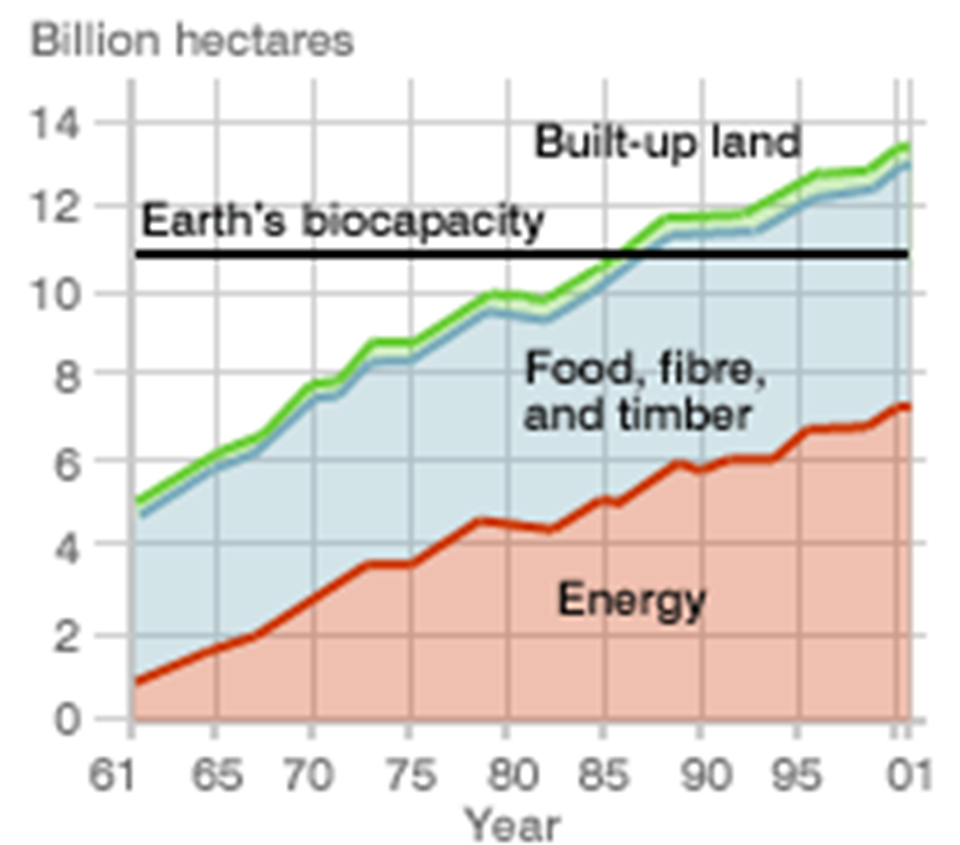
7. The EF
Ecological Footprint: Key Ideas
The ecological footprint (EF) is a theoretical measure of an individual or countries resource use / waste and the ecological impact.
Biocapacity measures the ability of ecosystems to provide resources and absorb wastes.
Footprints vary between countries due to development factors.
Country biocapacity is influenced by the relationship between three factors.
Biocapacity
Population
Ecological footprint (resource use)
A country with an EF smaller that its biocapacity is in ecological reserve
A country with an EF greater than it biocapacity is in ecological deficit.
Footprint revision in points
Definitions
Ecological footprint (EF)
Biocapacity
Ecological deficit / reserve
Relationship between biocapacity and ecological surplus /deficit
Reasons for a high EF (EG MEDC / LEDC increasing development)
Reasons for a low EF
Relationship between GNI and EF
Strategies for reducing personal / country EF
SACE 2022
The Great Green Wall initiative is one way of improving the sustainability of ecosystems.
Outline two other strategies to improve ecosystem sustainability. (2 and 2)
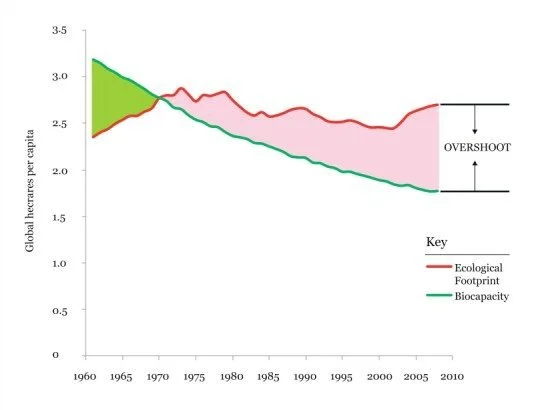
Ecological footprint and biocapacity can both be measured as either a per capita value or as the total global hectares (gha) for an entire population.
(Source 3) measures the ecological footprint and the biocapacity as the total global hectares for the nation of Mali from 1961 to 2017.
Since 1985, there has been a gradual increase in the total ecological footprint and total biocapacity.
Suggest why the total ecological footprint for Mali has been increasing since 1985. (1)
Suggest why the total biocapacity for Mali has been increasing since 1985. (1)

SACE 2021
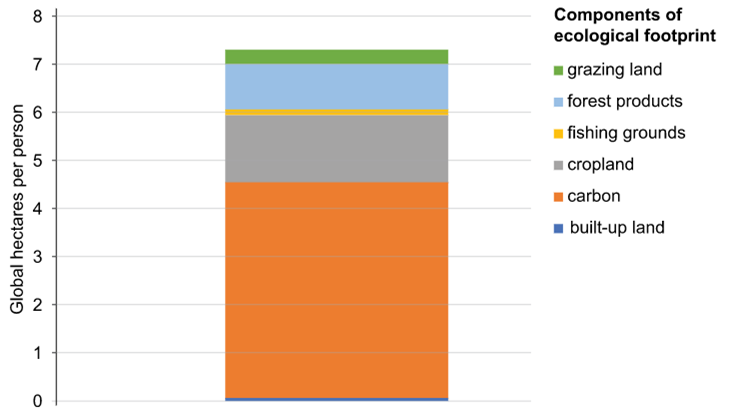
Refer to Source 1. Australia EF 2017
Explain two strategies that an individual could adopt to reduce their ecological footprint.
Each strategy must address a different component of the EF (4)
SACE 2019
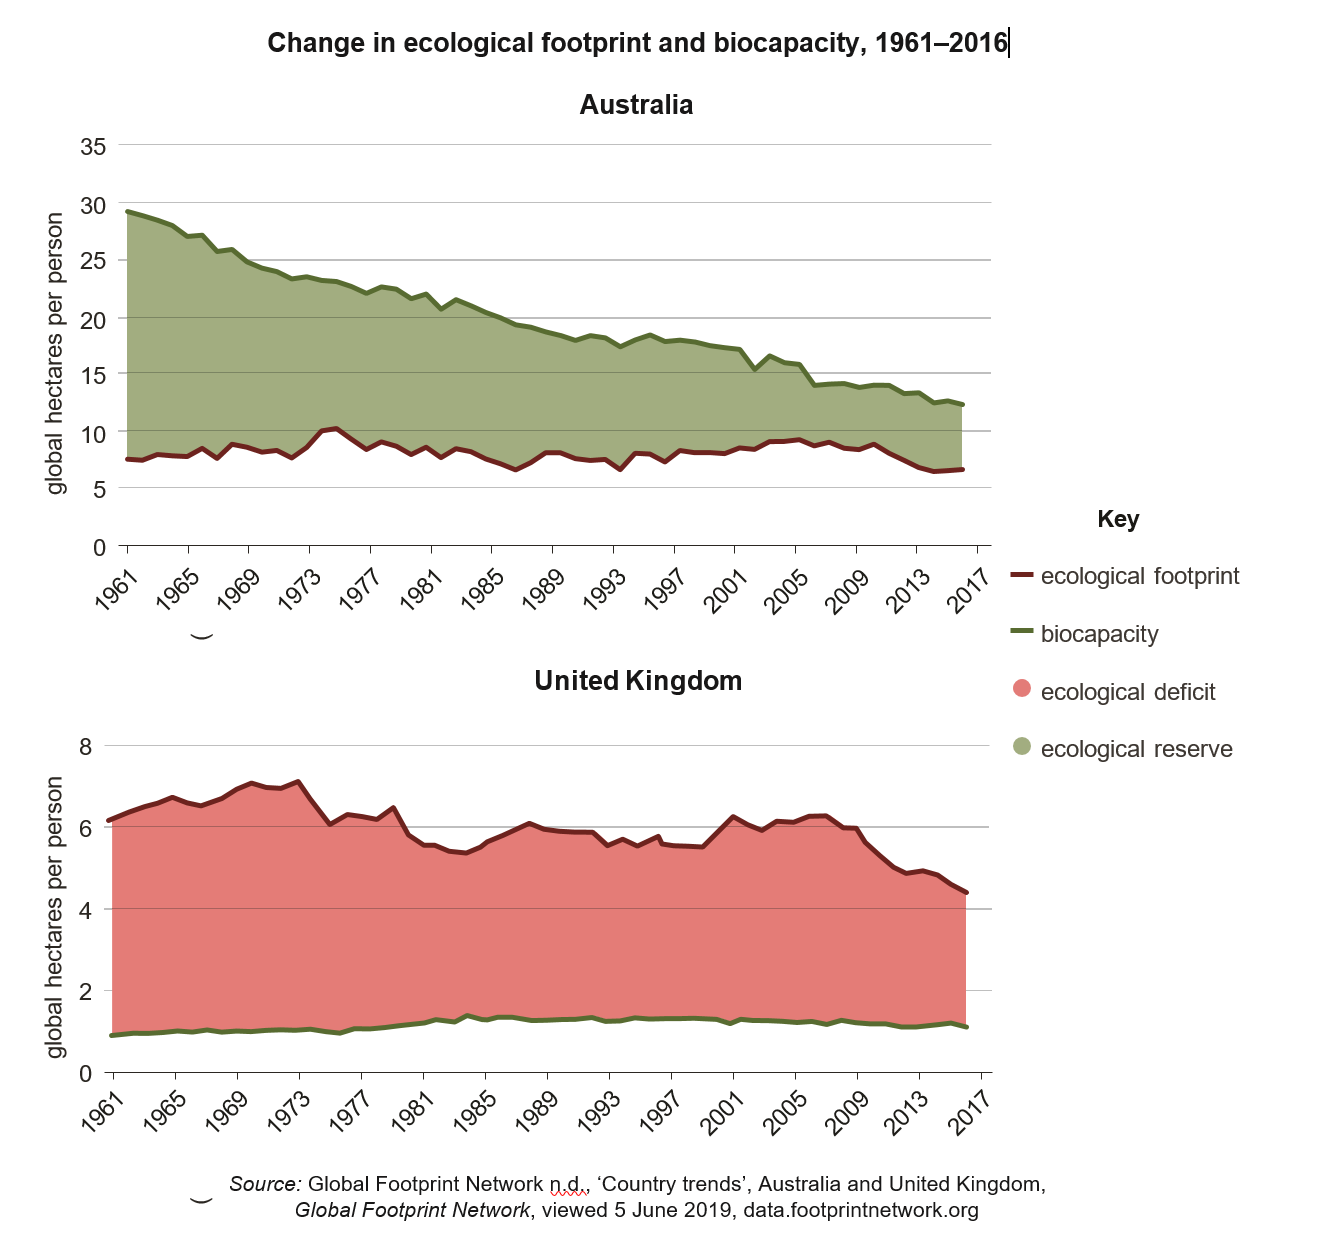
In which one of the following 4-year periods did the United Kingdom experience the largest decline in ecological deficit? Tick the appropriate box.
1969–73 1981–85 1993–97 2009–13
Explain why Australia has an ecological reserve while the United Kingdom has an ecological deficit.
Explain how countries with similar levels of economic development, such as Australia and the UK, can have ecological footprints that vary considerably in size and composition. Refer to Australia and the UK other countries in your answer.
With reference to examples from your studies, explain strategies that people can implement in order to reduce their ecological footprint.