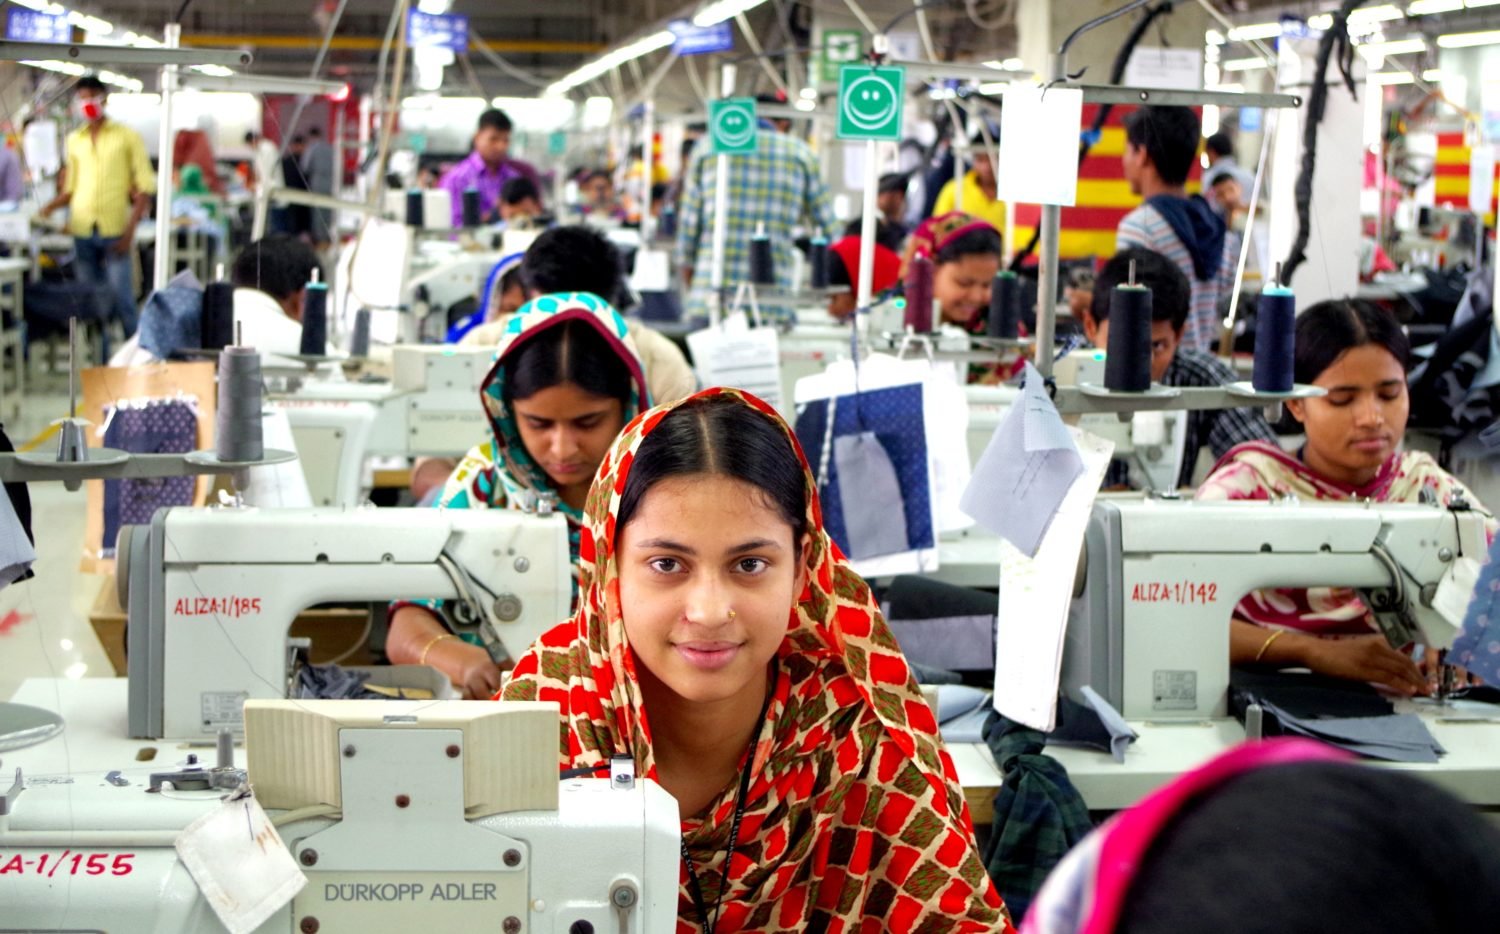
Task 1.Urbanisation
Key question: What are the causes and impacts of the unprecedented global migration of people to the world’s urban areas.
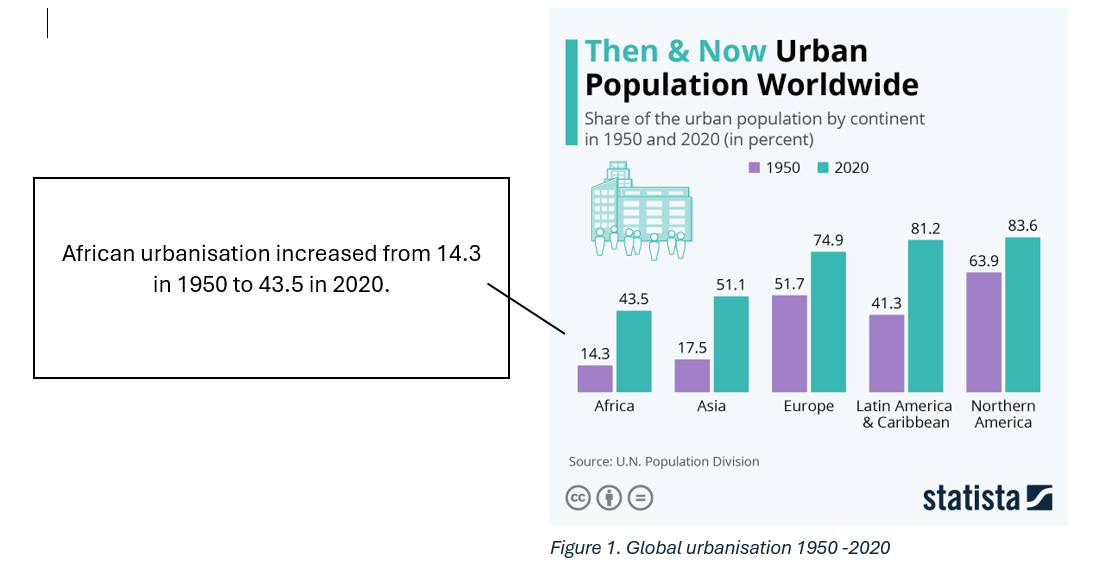
Since 1950, the world has experienced rapid urbanisation as millions of people have moved from rural areas to cities. Today, more than half of the world's population lives in urban areas, driven by industrialisation, employment, education and improved services.
Cities continue to shape economies, cultures and the environment.
Global urbanisation. The numbers
In 1950, about 30% of the world's population lived in cities. Today it is around 57%.
More than 5 billion people now live in urban areas.
The United Nations predicts that around 68% of people will live in cities by 2050.
There are now over 30 megacities, each with populations exceeding 10 million people.
Around one million people are added to the world's cities every week through migration and population growth.
Every year, cities expand by thousands of square kilometres to accommodate growing populations.
Although cities cover less than 3% of Earth's land, they generate more than 80% of global economic output.
Task 1: An examination of global urbanisation trends and challenges. (See below)
Part 1. Introduction to Urbanisation
Define and explain urbanisation.
2. Urbanisation trend in India
Describe and explain the urbanisation trend in India
The growth of India’s megacities.
3. Urbanisation in China
Investigate the pull factors driving urbanisation in China, between 1990 and the present day.
4. Source analysis. The challenge of urbanisation in Mumbai. India.
The challenges of rapid urbanisation in urban India
5. The Mayor of a rapidly growing LEDC megacity.
If you could only solve two problems over the next five years.
What would you choose?
Tips and tricks.
Include evidence to support your discussion and analysis. This could be in the form of maps, diagrams, and graphs or even images.
Captions and annotations
Make sure each image (Graphs and maps etc) is captioned and your annotations identify the key features.
Carefully check your work and proof read for spelling and grammar mistakes before submitting it.
Urbanisation Investigation
Part 1. Introduction to Urbanisation
Define urbanisation in your own words.
Use examples to describe the push factors causing people to leave their homes in rural areas
Use examples to describe the pull factors drawing people to the city.
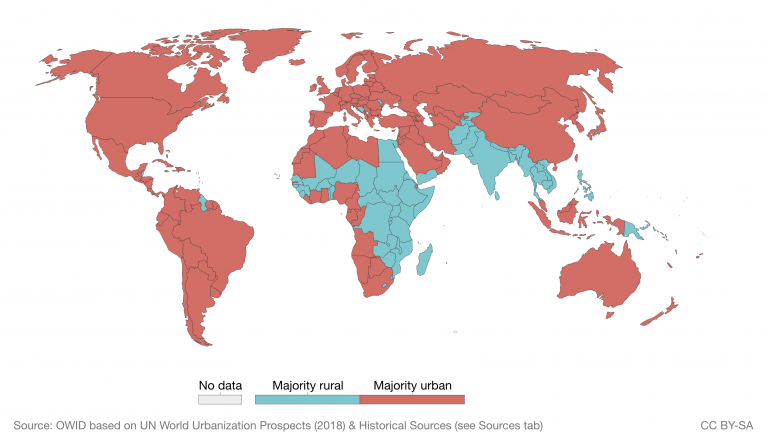
Annotate a map of global urbanisation.
Part 2. Urbanisation in India.
1. The urbanisation trend in India
The urbanisation trend describes the growth in the urban population in India.
According to the Outside Business, ‘India's urbanisation is accelerating, with urban areas now home to 35% of its population, projected to rise to 50% by 2050.’
Using Our World in Data allows us to access and use reliable global datasets on geography topics including urbanisation, population, health and the economy. You can use the Our World in Data graphs and maps or download the data and make your own.
Visual representations such as graphs help us identify trends and patterns in the data.
To do: Graph analysis
Copy the urban rural graph into your project.
Annotate the chart to compare the number of people living in urban and rural areas in India in 2025.
Describe the urbanisation trend in India from 1950 to 2025.
2. Number of people living in India’s cities.
According to the Urban Studies Institute ‘Urbanisation in India has been heavily concentrated in the largest cities rather than spread evenly across settlements. Over 70 per cent of the urban population live in large cities.
To do: Graph analysis
Copy the large cities graph into your project.
Annotate the chart to describe the growth of large cities in India between 1950 and 2020
Suggest reasons why New Delhi, Kolkata and Mumbai have grown the most.
Part 3. Urbanisation in China
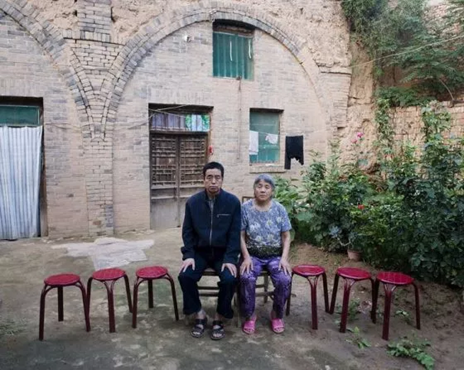
Rural Chinese who once shunned the 'pull' effect of major cities are now being 'pushed' there. According to Borgen magazine (2023), ‘China’s unprecedented urbanisation was partly driven by the disappointing reality of rural education in China.’
To do: The push factors
1. Define pull factors then use examples to describe three pull factors causing people to move to China’s urban areas.
2. Use annotated graphs or maps to illustrate your explanation of these factors.
Possible graphs to illustrate this section.
China % poverty
3. This is a graph showing the share of employment in China.
What do you notice about the percentage of people working in agriculture vs industry and services since 1991?
How does this graph reflect Urbanisation in China?
Extra: Download the data and make your own graph.
Part 4. Source. The challenge of urbanisation in Mumbai. India. (Internet Geography)
Read the source carefully before answering the questions.
Informal housing
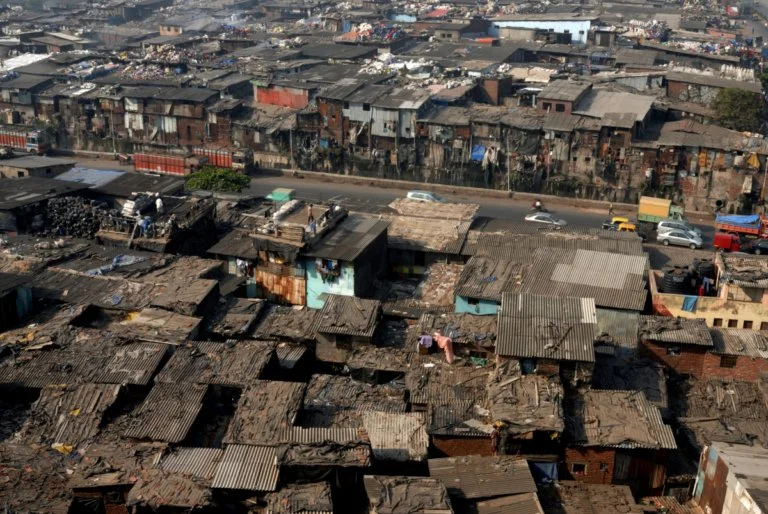
In Mumbai, slums have grown rapidly, spreading onto private land. They are typically poorly constructed and overcrowded.
Dharavi is Mumbai’s and India’s biggest informal settlement, with a population of approximately 1.2 million people crowded into one square mile. Many of the residents are second generation, living in small dwellings with many extended family members.
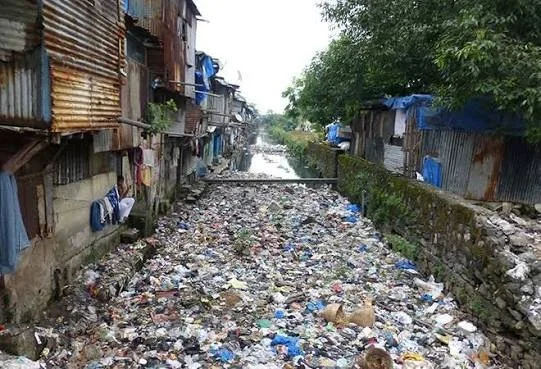
Conditions in Dharavi are challenging. People live by open sewers, and children play amongst the sewage waste. There is an average of 4,000 cases of typhoid and diphtheria each day. Access to freshwater is mainly through standpipes, which are turned on at 5:30 am for 2 hours, as water is rationed. There is an average of one toilet per 1,450 people. The average life expectancy is under 60 years old (compared to the national average of 69.27 years in 2020), due to disease and health concerns.
Providing clean water and sanitation.
60% of Mumbai’s population relies on communal taps. In some areas, access to freshwater is limited to only two hours. Many water pipes run close to sewers, and leaks can contaminate water, leading to the spread of waterborne diseases.
Only around sixty per cent of households are connected to Mumbai’s sewerage system, so many open sewers and polluted streams present a health risk. In the unplanned slum settlements, there is, on average, only one toilet per 1000 people. Only the wealthier suburbs typically have private water supplies. Factories heavily pollute the Mithi River, and 800 million litres of untreated sewage flow into it every day.
Providing access to services – health and education
Rapid urbanisation has placed considerable pressure on Mumbai’s strained health and education services. Hospitals have not kept pace with population growth. Many people have to wait a long time to be treated.
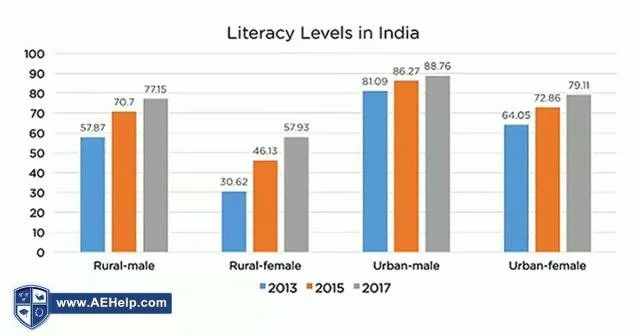
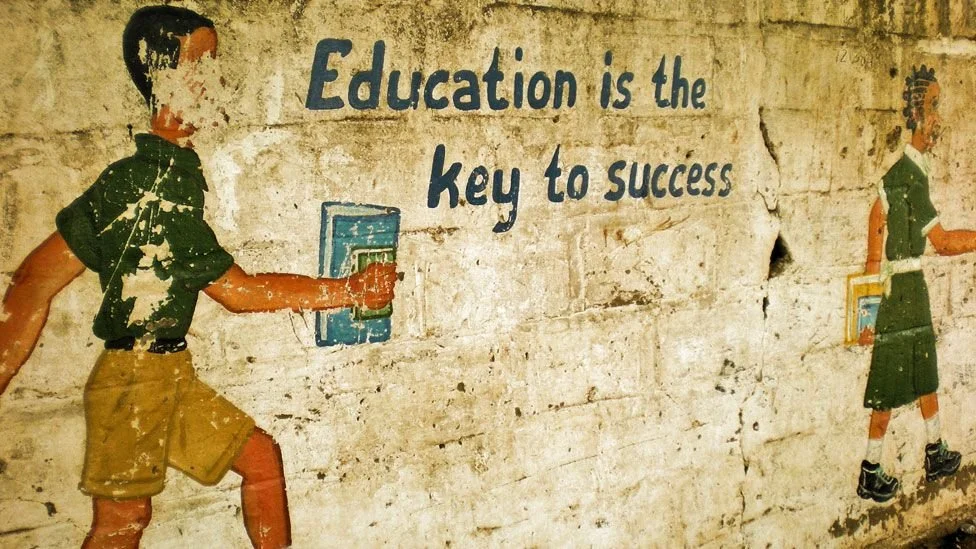
Despite improvements in education provision, many schools remain overcrowded, and there is a shortage of teachers. School dropout rates are high, and many students are unable to continue their education because they must work to support their families. This is particularly the case in slums and informal settlements.
Reducing unemployment and crime
Rapid urbanisation is the leading cause of unemployment in Mumbai. Economic growth has not been fast enough to create enough jobs for the available workforce. Underemployment is common (people are paid less than they should be for their task, with poor working standards).
In Mumbai, there is a shortage of technicians and skilled engineers. Most people work in the ‘informal sector’, which is low-paid, offers little job security, and often involves working in dangerous conditions. These workers do not pay tax on their earnings to the government.
Crime rates are very high in Mumbai. It has the third-highest crime rate of all Indian cities. Nearly one-third of the population has been victims of crime. Corruption is rife, and 22.9% of citizens have been exposed to bribery. Fraud and cybercrime are also widespread.
Pollution: waste disposal, air and water pollution, traffic congestion
Millions of tonnes of waste enter Mumbai’s Mithi River every year. Raw sewage and industrial pollution were above the safe limit. Human and animal waste were almost 15 times the safe limit! Doctors deal with 4,000 cases of typhoid and diphtheria each day.
In 2020, Mumbai had the 6th highest level of air pollution in India. Many people in the city are dependent on public transport. Buses and trains are often overcrowded. Traffic congestion is a significant problem in Mumbai, and peak traffic times can last several hours. Air pollution is very high due to the high number of old, inefficient cars, and there is also little regulation of emissions from factories.
Source. Mumbai urbanisation challenge questions
According to the source, approximately how many people live in Dharavi?
Name three challenges faced by people living in Dharavi.
Identify one statistic that shows overcrowding in Mumbai.
Explain why overcrowding can lead to the spread of disease.
Use evidence from the source to explain how rapid population growth has placed pressure on hospitals.
Use evidence from the source to explain the likely consequences of the following challenges.
Poor sanitation
Unemployment
Inadequate schools
Water pollution
Which challenge do you believe has the greatest impact on people's quality of life?
□ Housing
□ Water and sanitation
□ Education
□ Employment
□ Pollution
Use two pieces of evidence from the source to justify your answer.
Part 5. The Mayor of a rapidly growing LEDC megacity.
You are the mayor of a rapidly urbanising LEDC city with limited money.
If you could only solve two problems over the next five years.
What would you choose?
Explain why you believe these two issues should be the priority.
Current impacts of the two issue
Proposed benefits of solving each issue