
Task 3. Vulnerable Cities Folio.
Key question? Why are some cities more vulnerable to disasters than others, and what can be done to reduce their vulnerability?
Part 1. The spatial distribution of vulnerability
Refer to source 1 and 2 in assessing the spatial distribution of risk and vulnerability.
Questions
Describe two geographical patterns in the global distribution of disaster risk.
Identify two regions where high disaster risk overlaps with lower levels of development.
Explain why a country's level of development might influence its vulnerability to natural hazards.
Identify one limitation of using national level data to assess the vulnerability of individual cities.
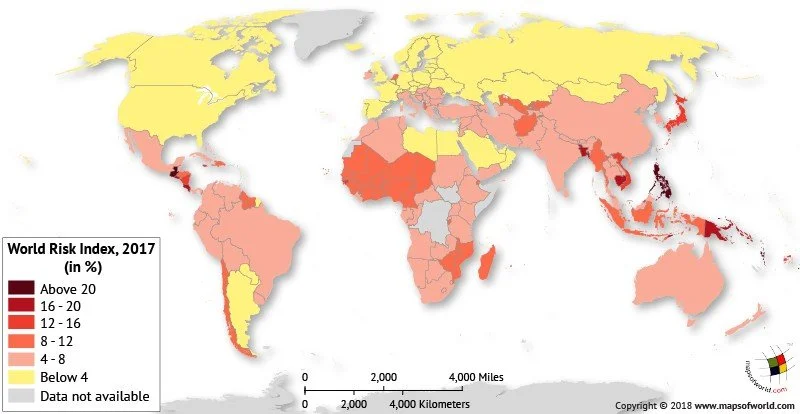
Source 1. Global word risk index. 2017
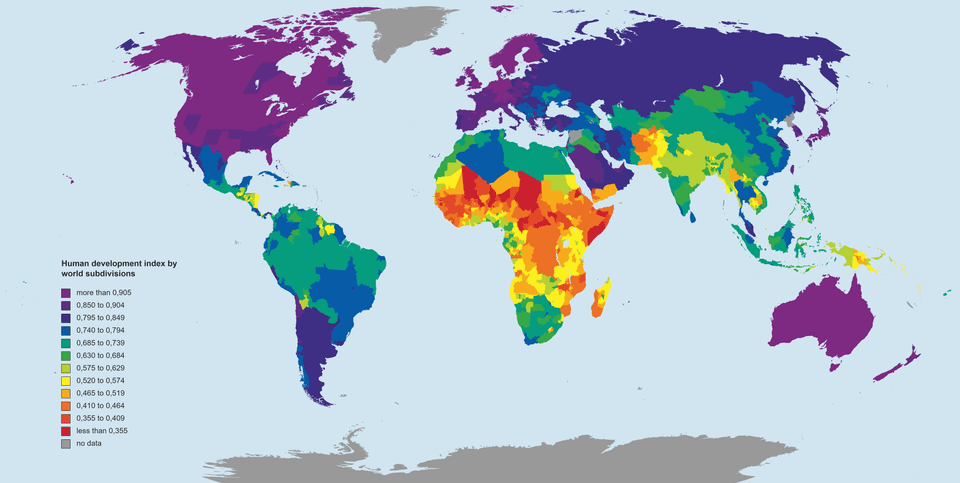
Source 2. HDI. Global subdivisions
Part 2. Measuring urban vulnerability
Use the data in source 3. to assess the vulnerability of the three cities.
Construct a graph comparing three vulnerability indicators across the cities.
Justify your indicator choices
Account for the significant differences in the data.
Select two indicators and explain how they could influence the vulnerability of a city to a major disaster.
Evaluate which of the three cities are the most vulnerable, using evidence from at least three indicators.
Explain why a single indicator cannot provide a reliable measure of vulnerability.
These indicators are for the respective countries. How useful is country data in assessing the risk in these cities?
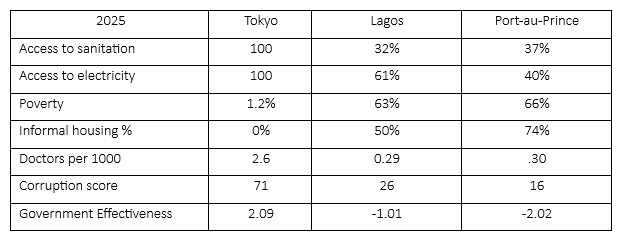
Source 3. Development Indicators
Part 3. Haiti case study. When vulnerability turns a hazard into a disaster
Refer to source 4 and source 5 to answer questions 1 and 2 in this section.
Source 4. Haiti Earthquake. 2010. Geofactsheet 285
The disaster management was chaotic, partly due to the low level of preparedness (a function of the country’s poverty, conflicts and poor governance) and partly due to the destruction of transport, communications, civil offices and the loss of personnel, virtually all connectivity was lost. In the first fortnight, tents could only be provided for 25% of the homeless, about 400,000. These were located outside the capital as there was no space due to rubble. This enforced emigration took people away from familiar surroundings at a time when they were most vulnerable. 18 hospitals and emergency clinics began working in Port-au-Prince.
Rebuilding Port-au-Prince. Slowly.
In the first year, only 1,179 new permanent houses were built nationwide, mostly outside Port-au Prince. Different aid groups worked independently, so various designs of housing were used, rather than a single plan for the whole city. Because progress was so slow, some locals started to rebuild homes themselves in the old ways, on soft ground or steep hillsides, using poor materials.
Questions
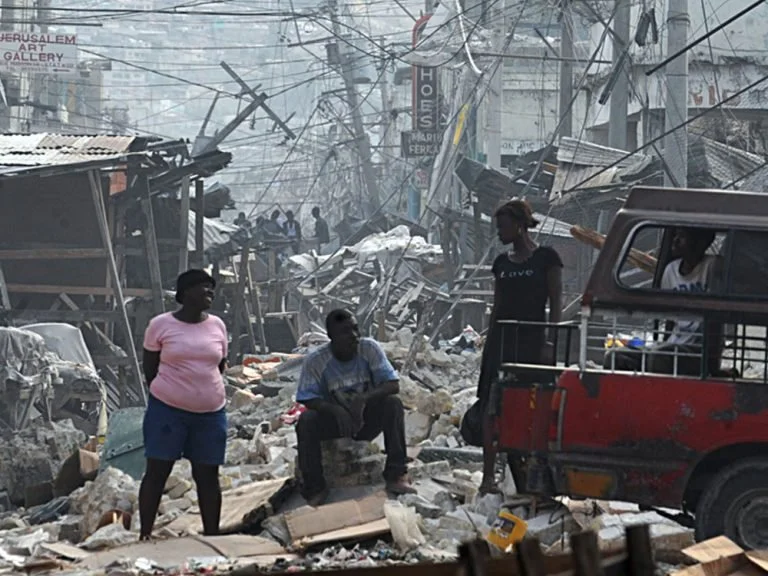
Identify two features visible in source 5. To describe the destruction in Port-au-Prince.
Explain how poor infrastructure and weak governance increased the consequences of the earthquake.
Use evidence from each of the sources (1-5) to assess the extent that the devastation was caused by the earthquake or the vulnerability of Port-au-Prince.
Part 4. Resilience strategies.
Relief Web recommends that cities develop strategies to reduce vulnerability to hazards.
Question
Using evidence from the sources, select and recommend the two (2) strategies that would most effectively reduce vulnerability in your chosen city. Explain why you have prioritised these strategies over the alternatives.
Strategies
Improve building standards
Upgrade informal settlements
Improve access to water and sanitation
Property rights
Strengthen governance
Improve disaster preparedness
Source 5. Haiti earthquake. 2010. Shelterbox.com