Task 3. Water Wise
Scenario: You are a junior geographer working for the South Australian Water Awareness Project.
Task brief: The project is preparing a community education resource called "Water Wise" for Year 7 students across South Australia.
Your job is to investigate one water related hazard and Australia's water resources, then explain what the evidence tells us about how we can keep our water supply sustainable.
Your inquiry question: How do hazards and the distribution of water resources affect Australian communities, and what can be done to manage water sustainably?
Choose your format
Present your findings as either a PowerPoint, Poster or Multimedia equivalent (video or podcast).
All formats must include a reference list (Harvard style utilized).
How to do the Water Wise task
Part A: Water resources in Australia (location, distribution and implications)
Describe the distribution of water resources in Australia.
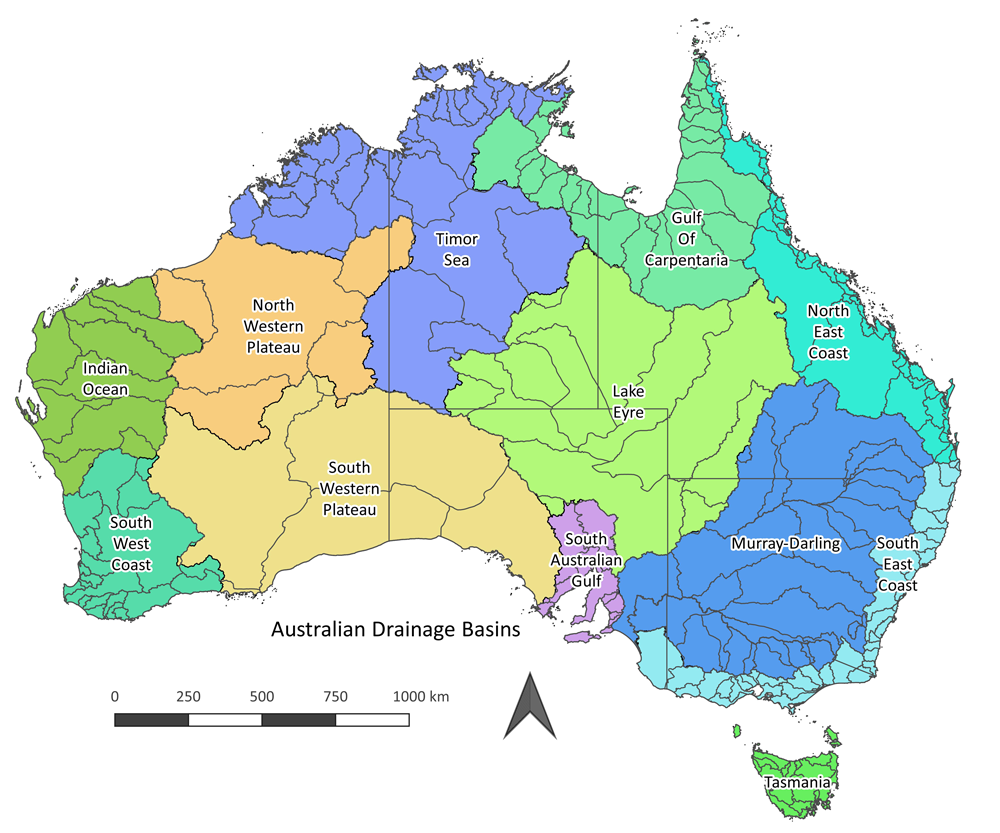
Map: Create or annotate a blank outline map of Australia showing the distribution of water resources. Include at least five of the following:
Murray-Darling Basin
Great Artesian Basin
Lake Eyre (Kati Thanda) Basin
Major rivers
Major dams or reservoirs
Location of high and low rainfall regions.
Annotate your map: Describe the pattern of water distribution (where is water plentiful, where is it scarce?).
Explain one implication of this distribution for people, the economy or the environment (for example, agriculture, population, or First Nations connections to Country and water).
Part B: Hydrological or atmospheric hazard case study.
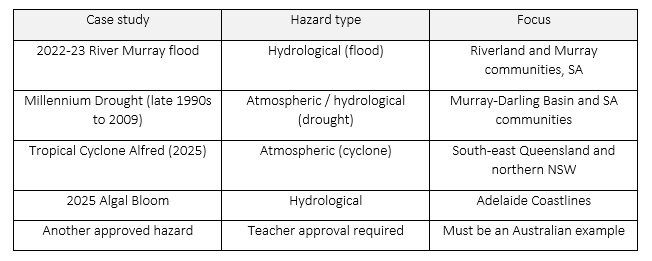
Choose one water hazard case study and explain the following:
Description of Hazard
Causes (natural processes, such as the water cycle, ocean and atmospheric influences, rainfall patterns, and any human factors).
Impacts (environmental, economic and social).
Responses from communities (for example, volunteers, sandbagging, local fundraising) and governments (for example, emergency services, water restrictions, recovery funding, policy changes).
A judgement: How effective were the responses? Justify using evidence.
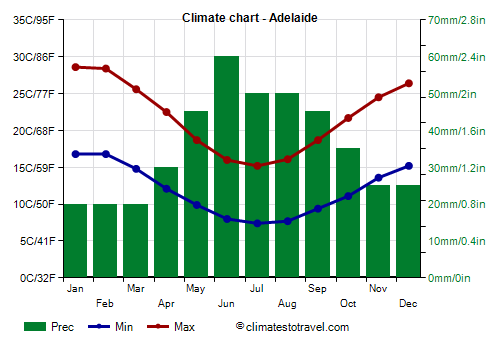
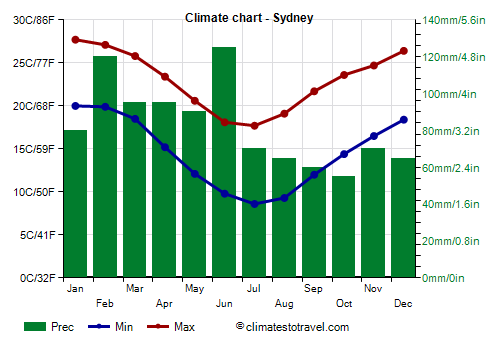
Part C: Rainfall graph analysis. Sydney and Adelaide
Use the graphs to answer the following questions about the climate and rainfall in the two cities.
Calculate the annual rainfall for each city. How much more rain does one city receive than the other?
Compare summer temperatures in the two cities. Use figures from the graphs to support your comparison.
In which months will each city experience the greatest pressure on its water supply? Consider both rainfall and temperature.
Recommend two water wise actions for a household in both cities. Explain how each action responds to that city’s climate.
Part D: Conclusions and sustainability strategies
What can be done to manage water sustainably?
Evaluate two strategies to manage water sustainability in Australia.
EG. water restrictions, stormwater harvesting, desalination, recycled water, environmental flows, efficient irrigation.
For each strategy, state one advantage and one limitation.
Recommend one action a community or government should prioritise and justify your choice.