Task 1. Deforestation Report
“Trees, how many of 'em do we need to look at?” Ronald Reagan, US President 1980 - 88
In this task you will create a report that examines the causes and impacts of deforestation around the world.
Report Outline - see below for guide to completing your report
1. Introduction:
Define deforestation and list the main causes of deforestation.
List the impacts of deforestation
Include a graph of global deforestation. Don’t forget to caption it!
2. Global deforestation map:
Build a GIS map of global deforestation rates
3. Deforestation Hot Spots:
Build a GIS map that examines five (3) deforestation hot spots around the world. (Include a viewable link in the report)
4. Deforestation satellite analysis:
Annotate and label satellite images of deforestation in the Amazon Basin to include in your report.
5. Tall trees deforestation - case study
A case study that examines one detailed example of deforestation.
6. Recommendations: for reducing the human impact on forests.

How to do the deforestation report
2. Global deforestation map:
We are going to map global deforestation using Google MyMaps
Use the following steps to create a GIS map of global deforestation rates.
How to start:
Download and save the excel spreadsheet with deforestation data for 2020 to your computer.
Open: Google My Maps
Select Add layer and select Import
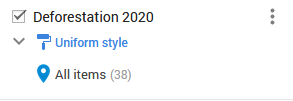
Select the excel file (The Deforestation 2020 file on your computer) and import the data.
Google will ask you to tick the place marks. Select Country
Continue and choose a column to title your markers: Select Country
Then Finish and My Maps will upload your data
Now you need to change the style of the markers.
Select Uniform Style
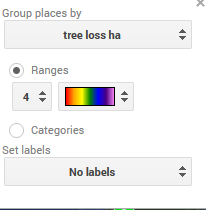
Click on the styled by data column and choose tree loss ha
Select Ranges
Choose a colour that represents a sliding scale
Screenshot the map and be sure to include a copy of the key
Hopefully ending with a map that looks like this
(Blue is the highest rate of deforestation)

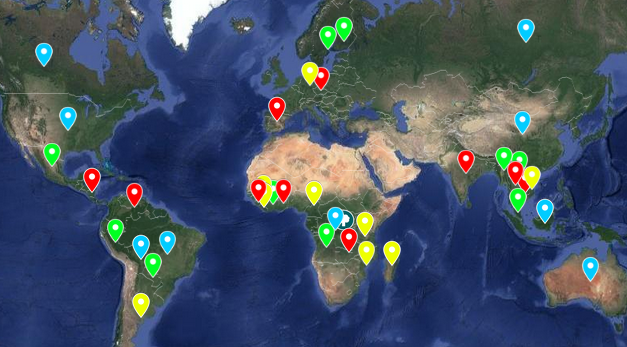
3. Deforestation Hot Spots:
Follow these steps to create an interactive GIS map of 3 of the world's deforestation hotspots.
How to start:
Research the following information about deforestation rates for three countries and record the data on a word document.
Country annual deforestation rate %
Main reason for deforestation in that country? (Land clearing for palm oil or grazing?)
Not so Fun facts about deforestation in the country
Suggested high deforestation rate countries:
Indonesia
Brazil
Australia
DRC
Russia
Now go to your Google My Maps page.
Click on the Add layer button
Click on Untitled Map and change the title of the map. EG Deforestation hotspots
You can also change your basemap to satellite view.
Search for each of the countries in the search bar. Click Add to Map
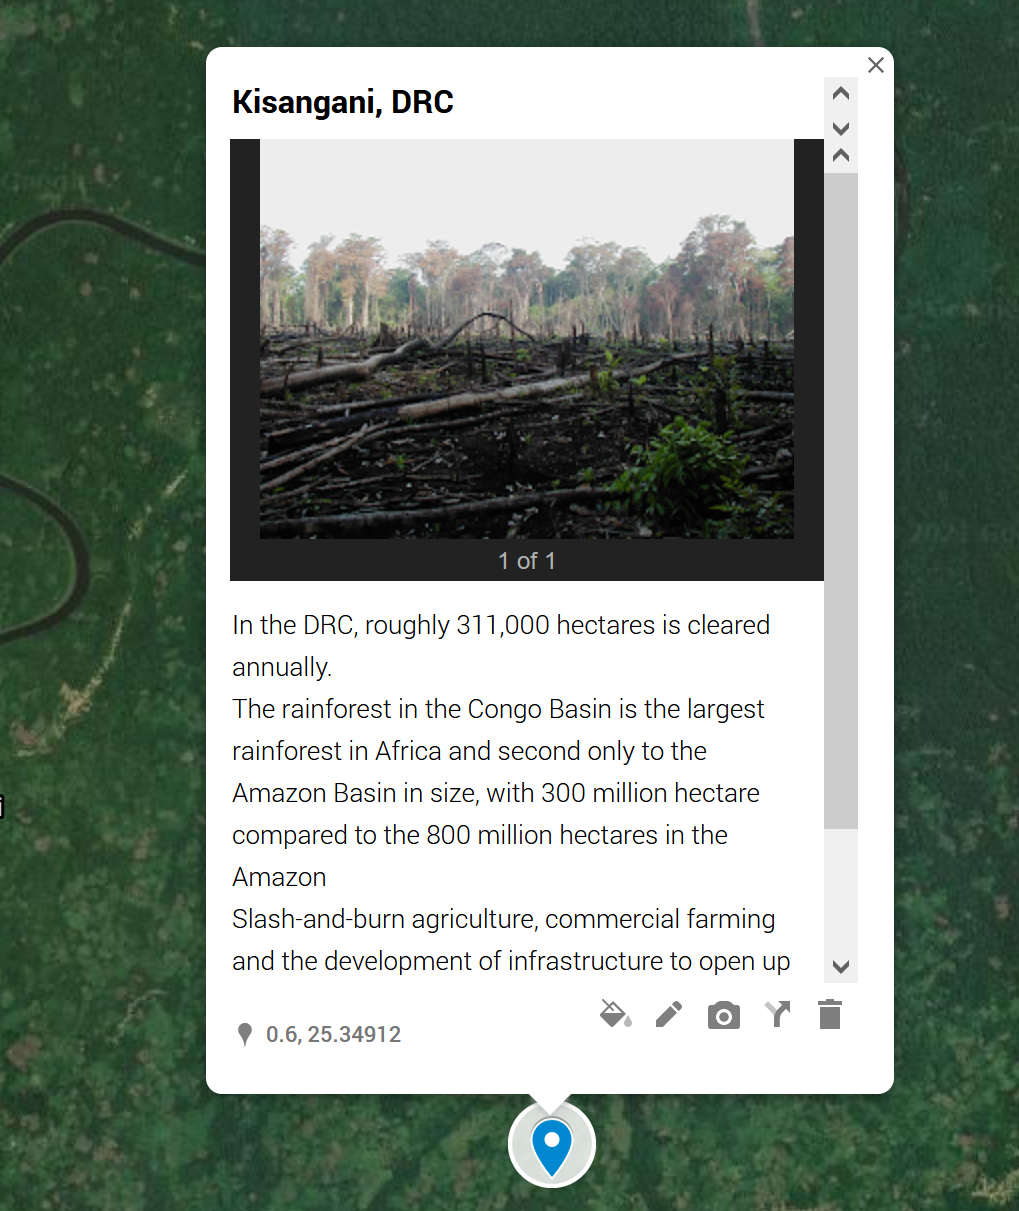
Click on the pin for the country and paste the deforestation data (From above) into the text box using the menu at the bottom of the entry. (pen for the information)
Extra: Paint tin for the icon and camera for google image search to include an image of land clearing in each country.
Click the camera icon and select Google image search. Example: Deforestation in Brazil.
Note: Sharing a Google MyMap
If you have gone to the trouble of creating a GIS map to support your report or project.
It would be good if other people can look at it.
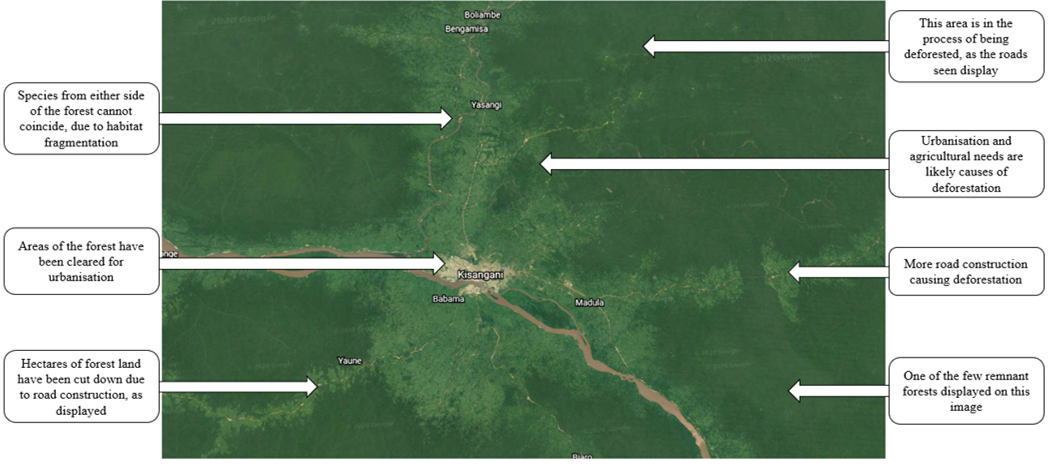
4. Deforestation satellite analysis
Follow these steps to do a satellite image analysis of deforestation.
How to start:
Go to the following site to examine deforestation in the Amazon:
Zoom in and find an area of deforestation and take a screenshot.
Pro tip: Turn off the shapes in the top right hand corner.
Label the human and natural features you can identify
Identify the evidence of the causes of deforestation.
Is there evidence of forest fragmentation?
What are the colours of the Rainforest?
How do the colours of the forest compare with the nearby farmland?
How would you explain the reason for the colours of the deforested areas?

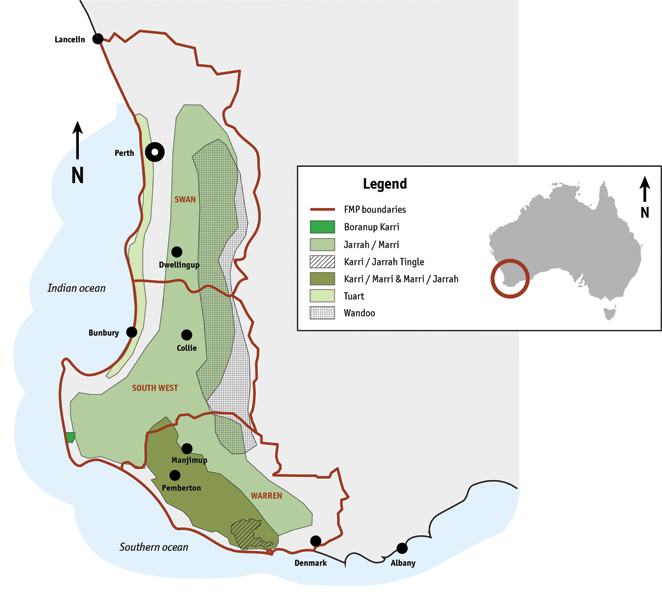
5. Deforestation case study: The tall forests of WA
About 2% of West Australia was forested at the time of settlement in 1829. The forested area stretches from Gingin in the north to Walpole in the south. The climate is Mediterranean with hot dry summers and cold wet winters. These conditions allowed the development of temperate high eucalyptus forests unique to Western Australia. Hardwood forests with species including Karri, Jarrah and Marri.
The forests have high conservation value as they are very biodiverse. However since white settlement in 1829, half of the tall forest cover in West Australia has been cleared (almost two million hectares). Much of the original clearance was for farming as sheep and cattle pastures replaced the forest.
Answer the following questions for a case study of the Tall forests of Western Australia.
Where are the forests of Western Australia located? (include a labelled map in your answer)
How much of the forest area has been cleared? (include an annotated map)
What is the climate of south west Western Australia. (Perth climate graph)
List the three (3) dominant tree species found in these forests. (Key species and conservation value?)
Why do conservationists value the biodiversity of these forests?
What is the main purpose for the clearance of the forest? (Is it logging or agriculture?)